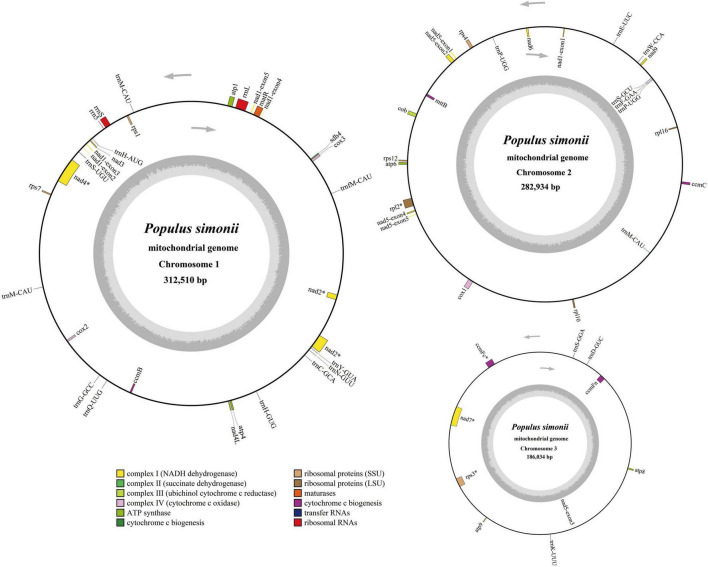
FIGURE 2.
Circular maps of the multi-circular mitogenome of P. simonii. Genomic features on transcriptionally clockwise and counterclockwise strands are drawn on the inside and outside of the three circles, respectively. GC content of each chromosome is represented on the inner circle by the dark gray plot. The asterisks (*) besides genes denote intron-containing genes.

