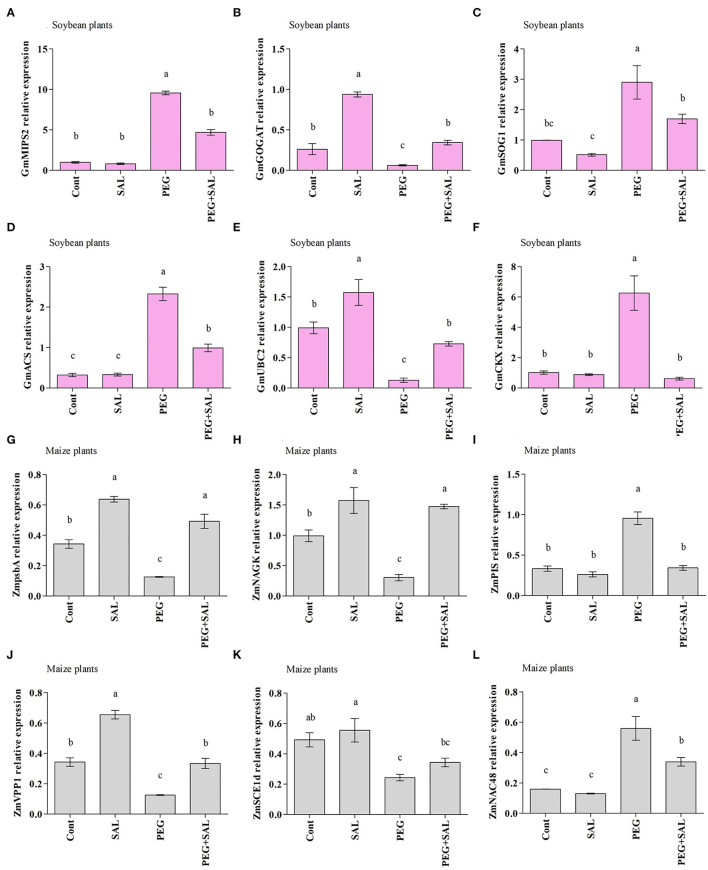
Figure 7.
Real-time expression analysis of GmMIPS2 (A), GmGOGAT (B), GmSOG1 (C), GmACS (D), GmUBC2 (E), GmCKX (F), ZmpsbA (G), ZmNAGK (H), ZmPIS (I), ZmVPP1 (J), ZmSCE1d (K), and ZmNAC48 (L) in leaves of soybean and maize plants grown under normal and stress conditions and treated with salvianolic acid for 8 days (8DAT). Treatments: Cont (control), SAL (0.1 μM salvianolic acid), SAL (1 μM salvianolic acid), PEG (25% polyethylene glycol), SAL (0.1 μM salvianolic acid) + PEG (25% polyethylene glycol), and SAL (1 μM salvianolic acid) + PEG (25% polyethylene glycol). Values show the mean ± SE (n = 6) and significant differences at p < 0.05 (Tukey's test). Bars with different lowercase letters are significantly different from each other.

