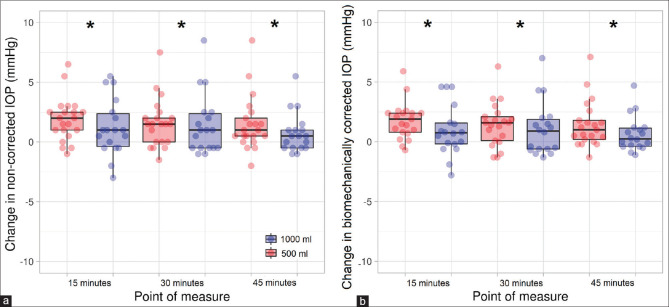
Figure 1.
Scatterplot and boxplot of the effect of water intake on intraocular pressure. The difference between the measurement taken after water ingestion and the baseline measurement for the non-corrected intraocular pressure values are displayed in (a) whereas the biomechanically corrected intraocular pressure values are shown in panel (b) * denotes statistically significant differences in comparison to the baseline measurement (corrected P < 0.05). The whiskers represent the interquartile range, and the horizontal lines indicate the median value

