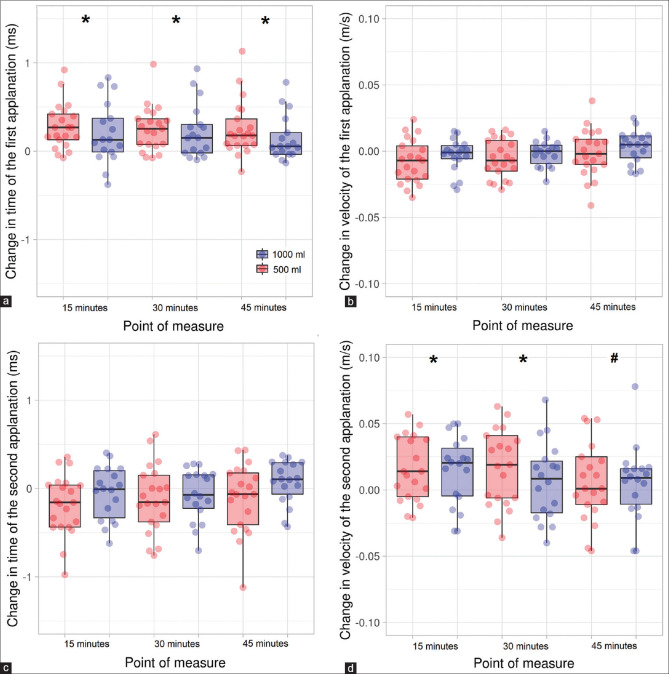
Figure 3.
Scatterplot and boxplot of the effect of water intake on time of the first applanation (a), velocity of the first applanation (b), time of the second applanation (c), and velocity of the second applanation (d). * and # denote statistically significant differences in comparison to the measurements at baseline and 15 min, respectively (corrected P < 0.05). The whiskers represent the interquartile range, and the horizontal lines indicate the median value

