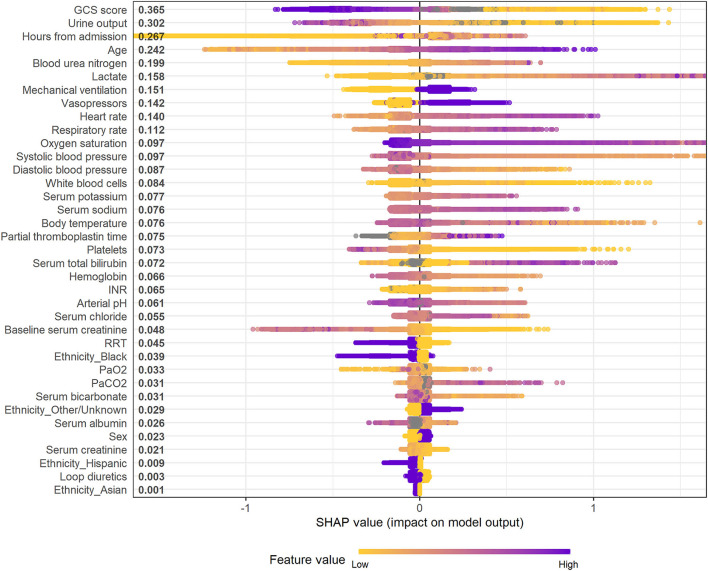
Figure 5.
SHAP summary plot of the XGBoost model for mortality in the following 48 h. Higher SHAP value means a higher probability of death within the next 48 h. Purple represents higher feature values and yellow represents lower feature values. A dot is created for each feature attribution in calculating the output risk for each observation. GCS, glasgow coma scale; INR, international normalized ratio; RRT, renal replacement therapy; PaO2, partial pressure of arterial oxygen; PaCO2, partial pressure of arterial carbon dioxide.

