
FIGURE 7.
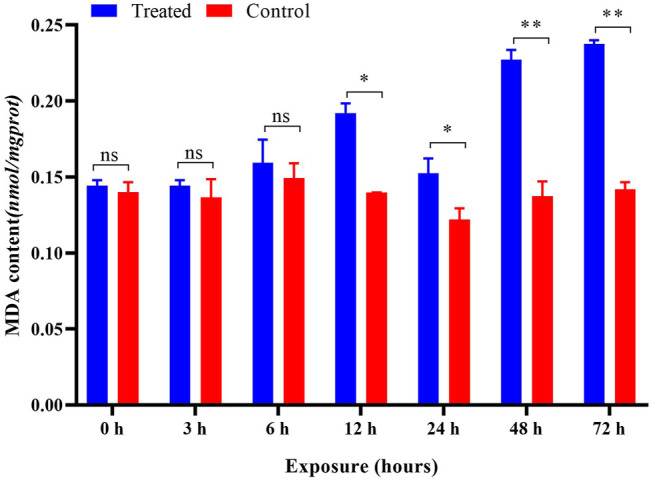
Effects of imidacloprid on the MDA content of P. analis. Each bar represents the mean of three replicates, and the error bars represent the standard deviation (SD). Significant values (*p < 0.05, **p < 0.01) refer to the difference between exposed samples and the controls.