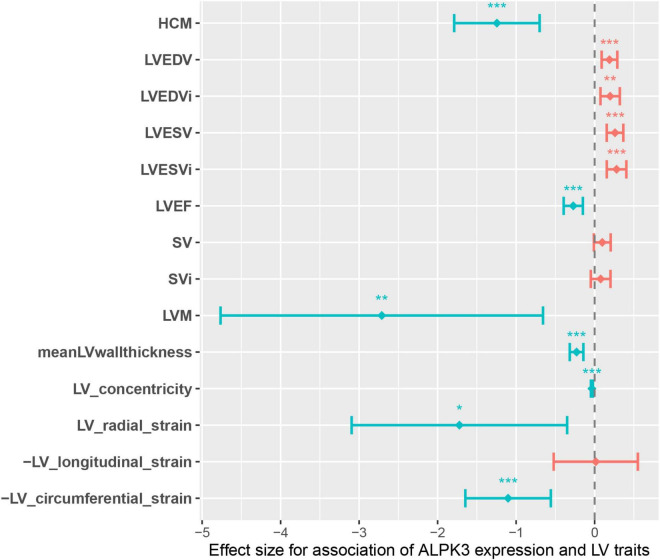
FIGURE 3.
Genotype-inferred ALPK3 expression-to-LV trait associations. Center values are the estimated association effect size and error bars indicate 95% confidence interval. Data shown correspond to that in Supplementary Table 7. LV, left ventricle/ventricular; LVEDV, LV end-diastolic volume; LVEDVi, body-surface-area (BSA) indexed LVEDV; LVESV, LV end-systolic volume; LVESVi, BSA indexed LVESV; LVEF, LV ejection fraction; SV, stroke volume; SVi, BSA indexed SV; LVM, LV mass; meanLVwallthickness, mean LV wall thickness. *P < 0.05, **P < 0.01, ***P < 0.001.

