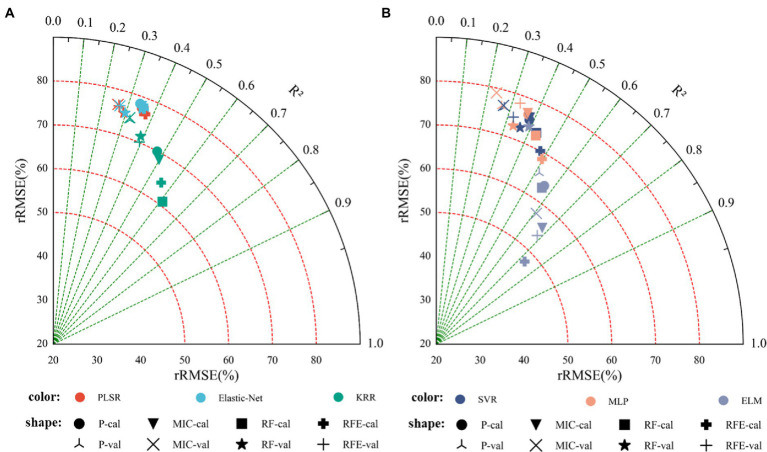
Figure 6.
Monitoring model result of cotton yield based on the visible vegetation indices (Note: P denotes feature parameters screened out based on Pearson’s correlation coefficient, cal denotes training set; val denotes validation set. (A) Modeling results based on linear regression, (B) modeling results based on nonlinear regression).

