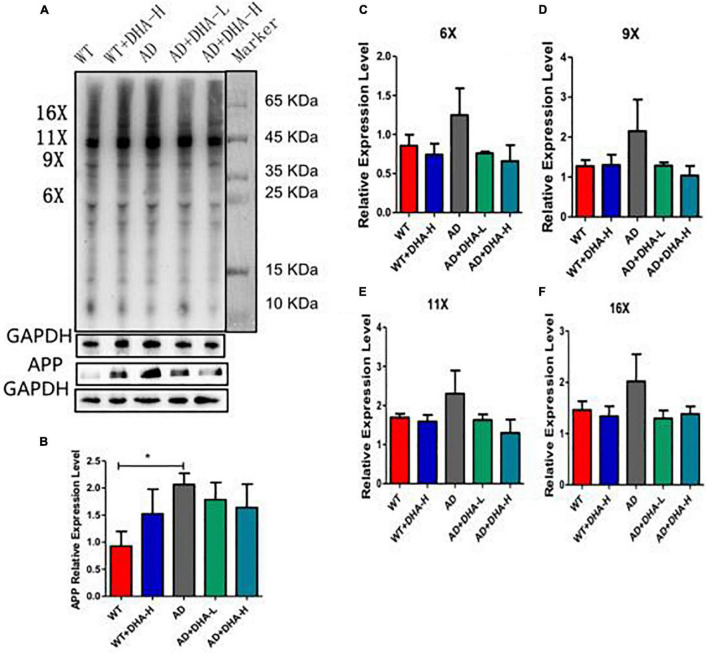
FIGURE 3.
Detection of Aβ protein levels in mouse cortex tissue (n = 4). (A) Western blot detection of the expression levels of Aβ oligomers and APP in hippocampus; (B) Quantitative analysis of gray value of APP protein expression level; (C) Quantitative analysis of gray value of 6-fold oligomer of Aβ protein; (D) Aβ protein 9 Gray value quantitative analysis of fold oligomers; (E) Gray value quantitative analysis of Aβ protein 11-fold oligomers; (F) Gray value quantitative analysis of Aβ protein 16-fold oligomers (*p < 0.05).

