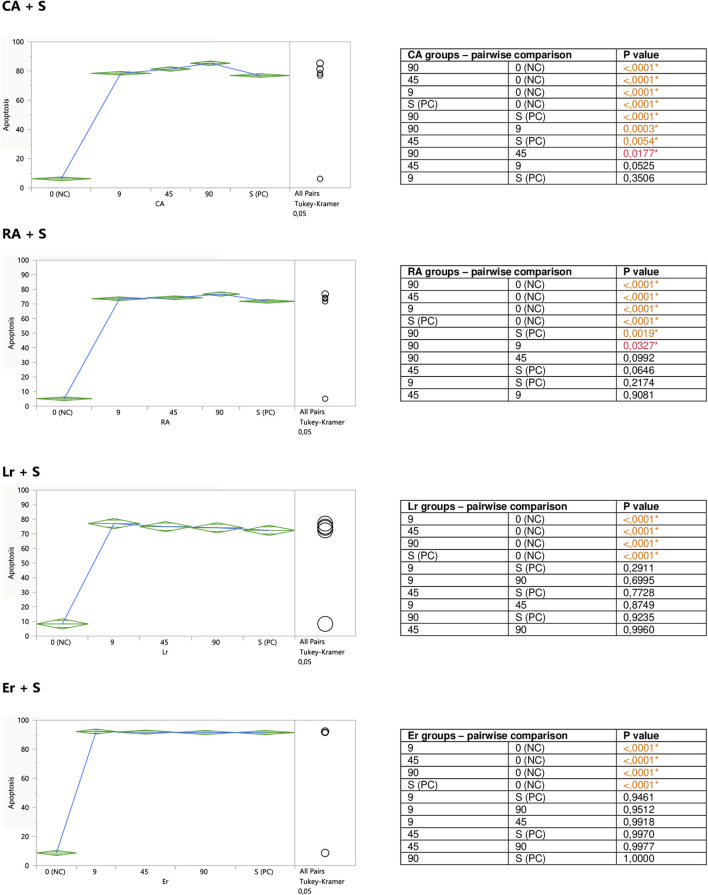
FIGURE 7.
Modulatory effect of CA, RA, Lr, and Er on staurosporine-induced apoptosis of Jurkat cells. 0 (NC) = negative control (untreated Jurkat cells); S (PC) = positive control (Jurkat cells treated with staurosporine); 9, 45, 90 = Jurkat cells incubated with a given (poly)phenol at the concentration of 9, 45, or 90 μM, and subsequently treated with staurosporine. Apoptosis = percent of apoptotic cells. Means diamonds illustrate ANOVA analysis (upper and bottom points are at 95% confidence points of each group). The circles on the right express significant differences between group means (if they do not overlap) or the lack of significant differences (if they overlap).

