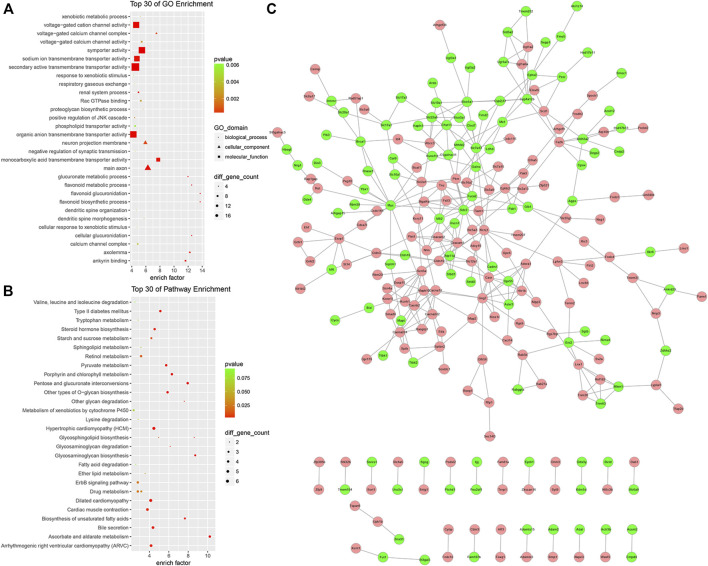
FIGURE 7.
GO enrichment analysis, KEGG enrichment analysis, and PPI network of the circRNA ceRNA network. (A) GO Enrichment annotation of circRNAs. (B) KEGG pathway enrichment of circRNAs. (C) PPI network of the circRNA ceRNA network. Pink and green nodes denote upregulated and downregulated protein-coding genes, respectively. PPI, protein-protein interaction.

