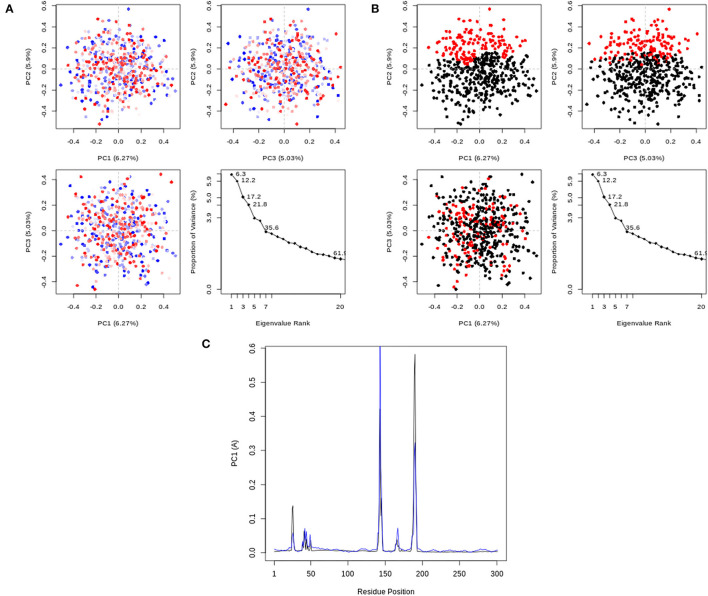
Figure 8.
PCA results, comprising graphs of PC2 vs. PC1, PC2 vs. PC3, PC3 vs. PC1, and an eigenvalue rank plot with the cumulative variance annotated for each data point. (A) PCA plots colored from blue to red in order of time; (B) PCA Plots showing two different clusters colored black and red. (C) Residue-wise loadings for PC1 (black) and PC2 (blue).

