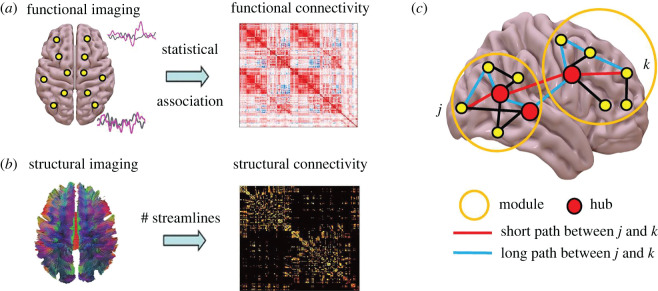
Figure 2.
Connectivity in the human brain. (a) Functional connectivity can be quantified from functional MRI, as the linear correlation statistical relationships between BOLD signals. (b) Structural connectivity can be quantified from diffusion-weighted MRI, as the white matter streamlines between regions. (c) Graph theory can characterize local properties of individual nodes (e.g. high-degree nodes or ‘hubs’) but also mesoscopic properties (e.g. modular organization) and macroscale (e.g. average shortest path length in the network).

