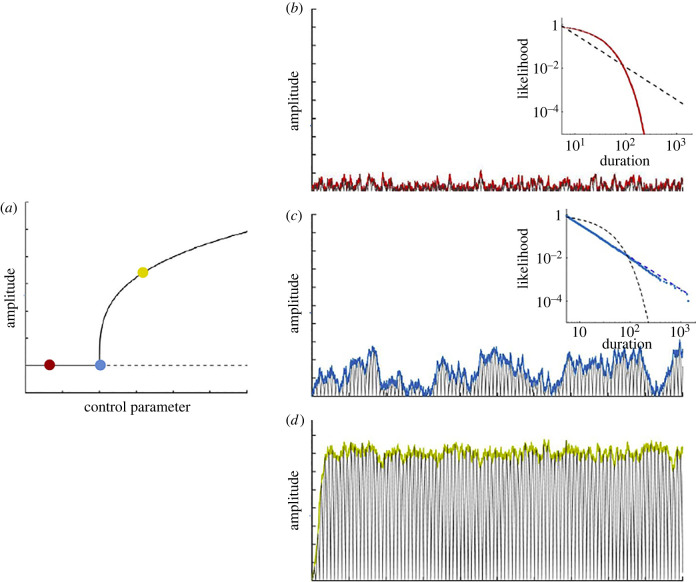
Figure 3.
Criticality in a low-dimensional system consisting of a few interacting components. (a) Diagram of a supercritical bifurcation depicting the amplitude of a system's state variable (y-axis) as a function of a control parameter (such as the strength of interactions, x-axis). When the control parameter is increased, the activity of the system switches from subcritical (red circle) to a supercritical regime (yellow circle). The point of change is known as the critical point (blue circle). (b) In the presence of noise, the subcritical system (red circle) systematically returns to the steady state equilibrium with rapidly decaying amplitude. The duration of high amplitude events follows an exponential probability distribution (red dots, inset). (c) At the critical point, the amplitude fluctuations have high variance, rising and falling slowly due to the transient stability of oscillations. The relationship between the duration and the likelihood of high amplitude oscillations follows a power law distribution, corresponding to a linear relationship in double logarithmic coordinates with a slope described by a critical exponent of −3/2 (inset). (d) Beyond the critical point, the system is in a supercritical regime and exhibits sustained oscillations with small amplitude variability. Adapted from [28] with permission from Elsevier.

