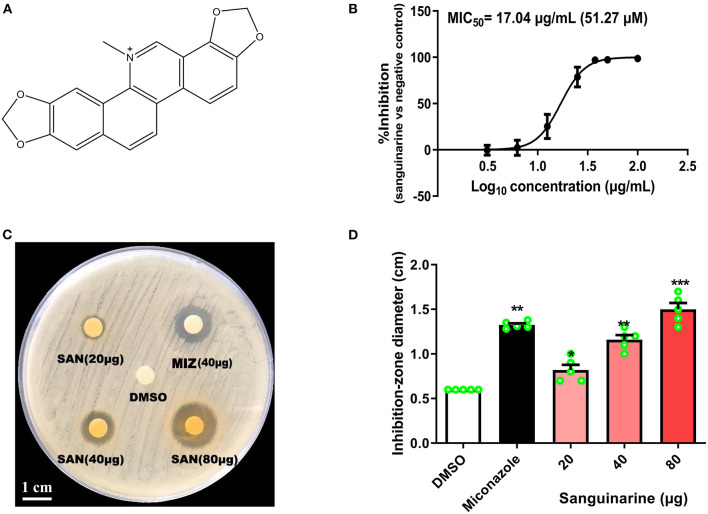
Figure 1.
(A) Molecular structure of sanguinarine (SAN). (B) SAN dose–response curve for inhibitory effects against C. albicans (ATCC 10231). A seven-point dose–response relationship was determined for SAN in the antifungal microbroth dilution assay. The data were plotted as percentage of control (100%) at each dose point. The MIC50 value was determined at 24 h incubation. (C) A representative C. albicans petri-dish sample with the zone of inhibition marked. (D) Effects of SAN on the inhibition zone diameter produced against C. albicans. Miconazole (MIZ, 40 μg) was served as a positive control. Values are expressed as mean ± SD, n = 3. *p < 0.05, **p < 0.01 and ***p < 0.001 vs. the DMSO control group.

