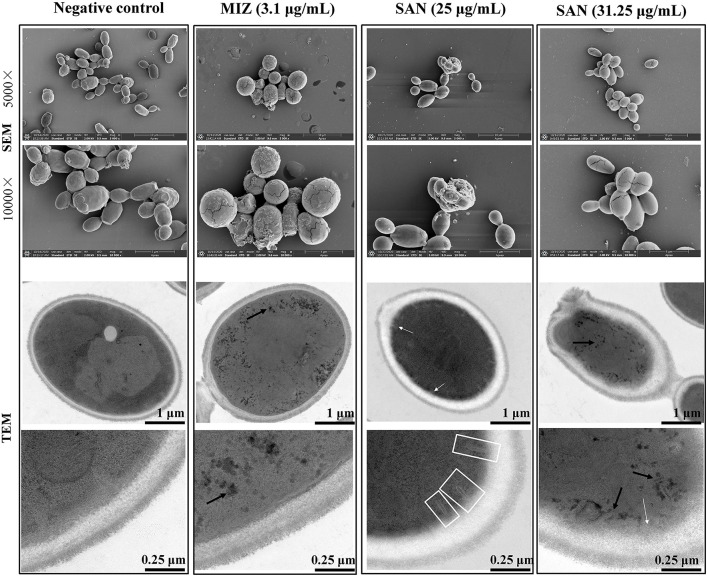
Figure 2.
SEM and TEM visualization of the cross sections of the untreated miconazole and SAN-treated C. albicans (ATCC 10231) cells after 24 h. Cells were observed under SEM at 5000× and 10000× magnification. TEM showed the changes in cell ultrastructure after incubation with SAN or miconazole including the following: cell showing organelles leakage from vacuole (black arrows), multilayer structures (shown by white arrows) in the plasma membrane, and invaginations of the plasma membrane extending into the cytoplasm (shown by white frames). Three independent experiments, six biological replicates/group, were performed for each drug treatment. Micrographs in this image represent one of six biological replicates analyzed.

