FIGURE 2.
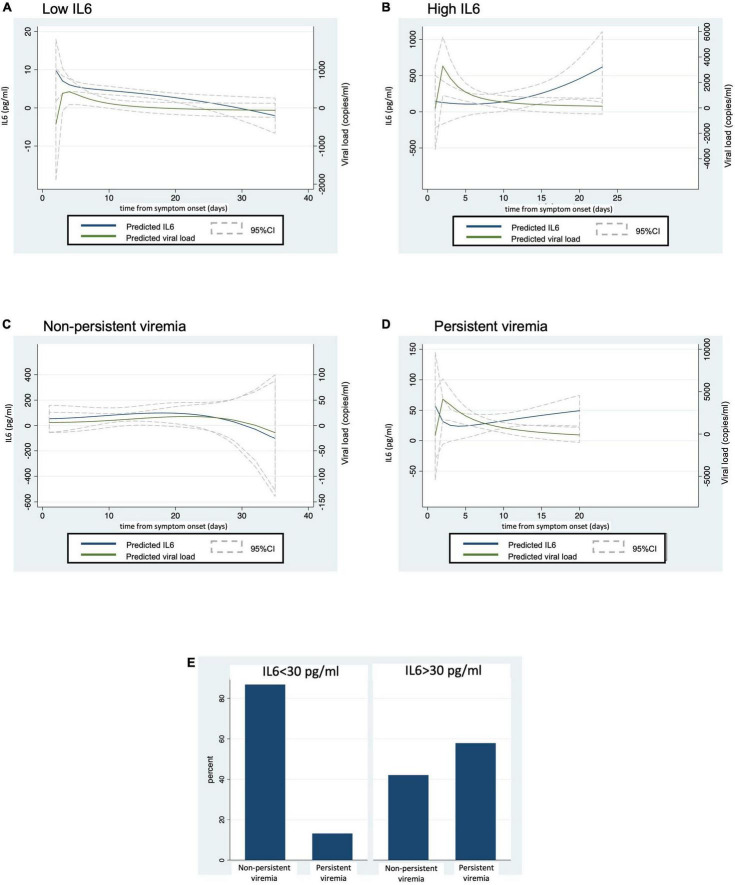
Patients with worse outcomes have an early peak of SARS-CoV-2 viral load before a prominent increase in IL6 levels. Graphic representation of IL6 levels and SARS-CoV-2 viral load from symptom onset in: (A) patients with low IL6; (B) patients with at least one IL6 > 30 pg/ml (high IL6); (C) non-persistent viremia; and (D) persistent viremia. (E) Represents the percentage of patients with persistent viremia according to IL6 levels (low vs. high). (A–D) The fractional polynomial predictions were performed using the twoway command of Stata.

