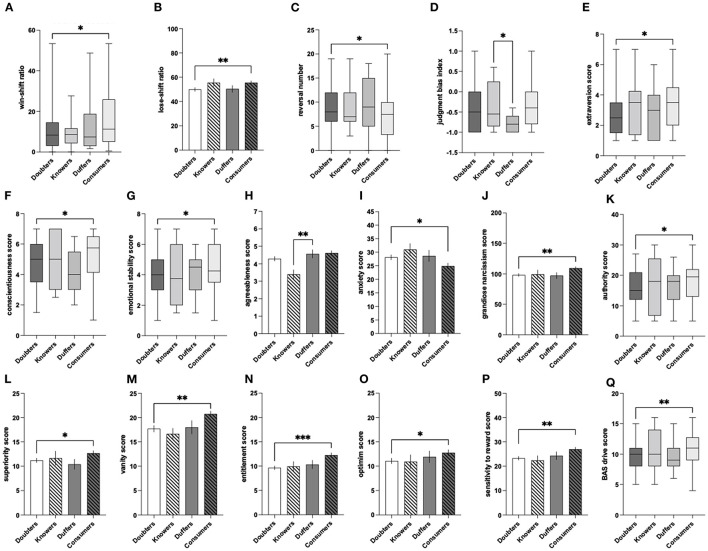
Figure 11.
Interphenotypic differences in the ratings of declared engagement for (A) win-shift %; (B) lose-shift %; (C) reversals; (D) cognitive judgment bias; (E) extraversion; (F) conscientiousness; (G) emotional stability; (H) agreeableness; (I) anxiety; (J) grandiose narcissism; (K) authority; (L) superiority; (M) vanity; (N) entitlement; (O) optimism; (P) sensitivity to reward; (Q) BAS drive for (A) conscientiousness; (B) anxiety; (C) grandiose narcissism; (D) authority; (E) superiority; (F) vanity; (G) entitlement; (H) BAS drive; and (I) BAS reward responsiveness. The data are presented as AVG ± SEM (the bar plots) or median with interquartile range (the box plots). *P ≤ 0.05 **P ≤ 0.01 ***P ≤ 0.001.

