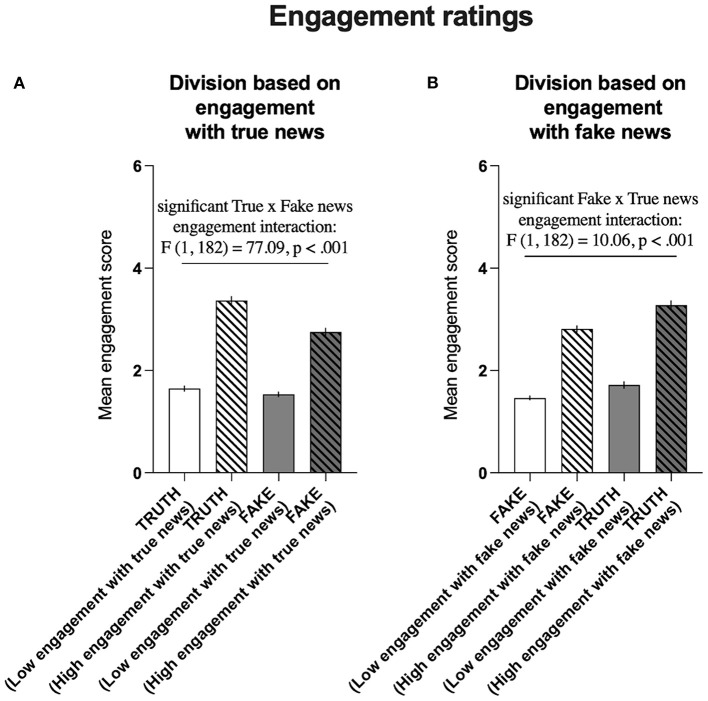
Figure 9.
Division based on declared engagement with true and fake news. (A) Comparison of the declared average engagement with true news ( ) with the average declared engagement with fake news (
 ) in groups that were differentiated based on the average low (N = 94) and high (N = 90) declared engagement with true news (
 ). (B) Comparison of the average declared engagement with fake news (
 ) with the average declared engagement with true news (
 ) in groups that were differentiated based on the average low (N = 93) and high (N = 91) engagement with fake news (
 ). The data are presented as AVG engagement ratings ± SEMs.

