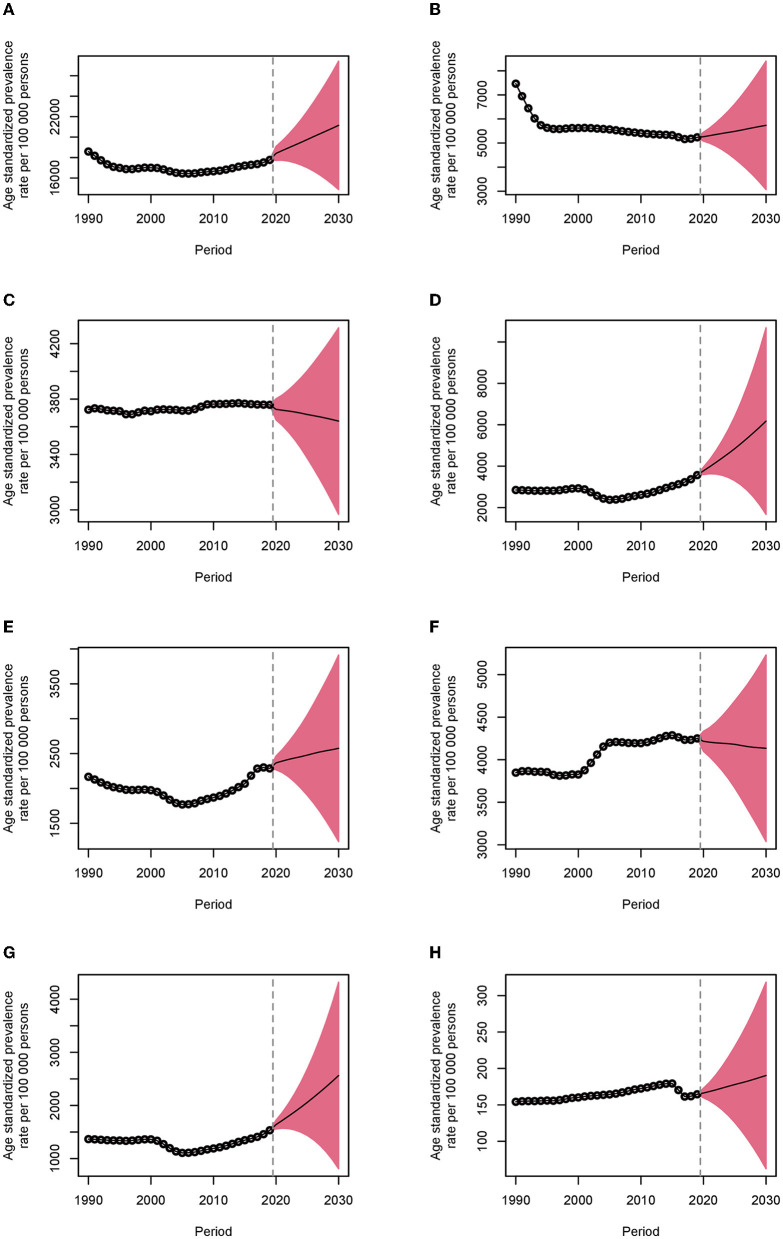
Figure 3.
Age-standardized prevalence rates of musculoskeletal rehabilitation needs in China from 1990 to 2030. The dots indicate the observed rates, and the fan plot presents the predicted values with 2.5 and 97.5% quantiles. The solid line indicates the predicted mean values. The vertical dashed line shows when the prediction begins. (A) Musculoskeletal disorders. (B) Low back pain. (C) Neck pain. (D) Fractures. (E) Other injuries. (F) Osteoarthritis. (G) Amputation. (H) Rheumatoid arthritis.

