FIGURE 1.
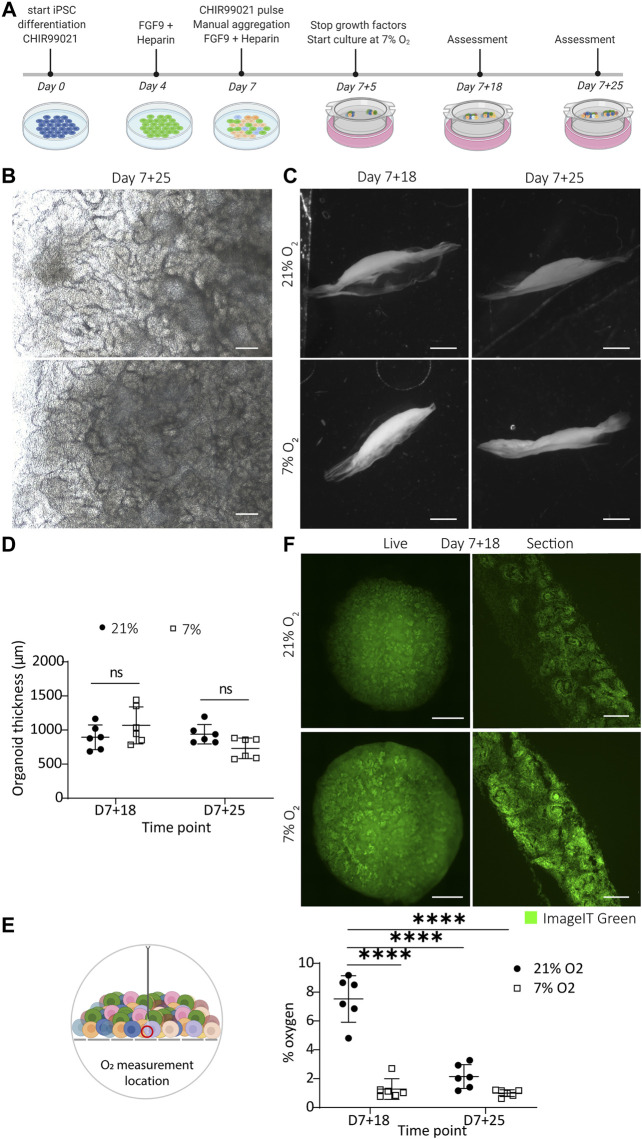
Kidney organoids cultured in uterine-like hypoxic environment structurally form like their normoxic counterparts without the appearance of a hypoxic core. (A). Schematic representation of the iPSC differentiation and organoid culture. Human iPSCs are differentiated for 7 days, after which aggregates are spotted on the air–liquid interface and cultured as organoids for up to 25 additional days (termed day 7 + 25). (B). Brightfield images display comparable morphologies of the organoids cultured in 7 and 21% O2 at the culture endpoint day 7 + 25. Scale bar: 200 µm. (C). Darkfield images show that the macro-anatomy of the organoids is comparable in both oxygen concentrations. Scale bar: 2 mm. (D). Quantification of the organoid thickness from the darkfield images shows no difference between 21% O2 and 7% O2. (n = 2, N = 3). (E). Oxygen measurement in the bottom part of the organoids towards the transwell filter shows that organoids in 7% oxygen have a comparable oxygen concentration to their normoxic counterparts at day 7 + 25, which is significantly lower compared to the normoxic condition at day 7 + 18. (n = 2, N = 3; **** = p ≤ 0.0001) (F). Organoids (left column) and cryosections of their central core (right column) stained on day 7 + 18 with the hypoxia dye ImageIT Green that produces a fluorescent signal below 5% O2. The organoids display no hypoxic core but the dye stains all nephrons. Scale bar “live”: 1 mm, scale bar “section”: 100 µm.

