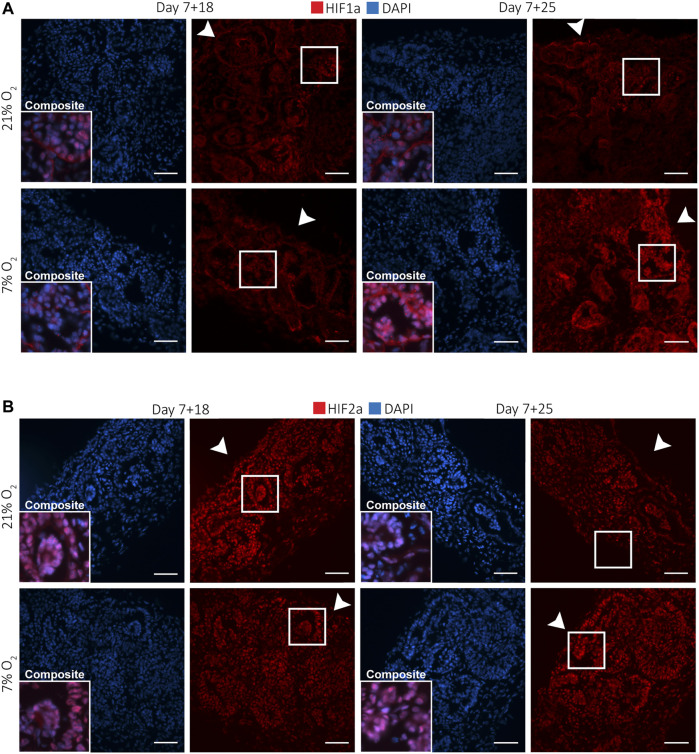
FIGURE 3.
Kidney organoids cultured in both 7 and 21% O2 show differential nuclear translocation of HIF1a and HIF2a. (A). Immunofluorescence staining for HIF1a (red) and DAPI (blue) shows increased nuclear translocation in podocytes (composite), particularly in 7% O2 at day 7 + 25. Scale bar: 50 µm. (B). HIF2a (red) and DAPI (blue) immunofluorescence staining shows nuclear translocation in most cells within the organoid irrespective of the oxygen concentration or time point. (n = 3, N = 3). Scale bar: 50 µm. Arrowheads indicate the (air-exposed) surface of the organoids.

