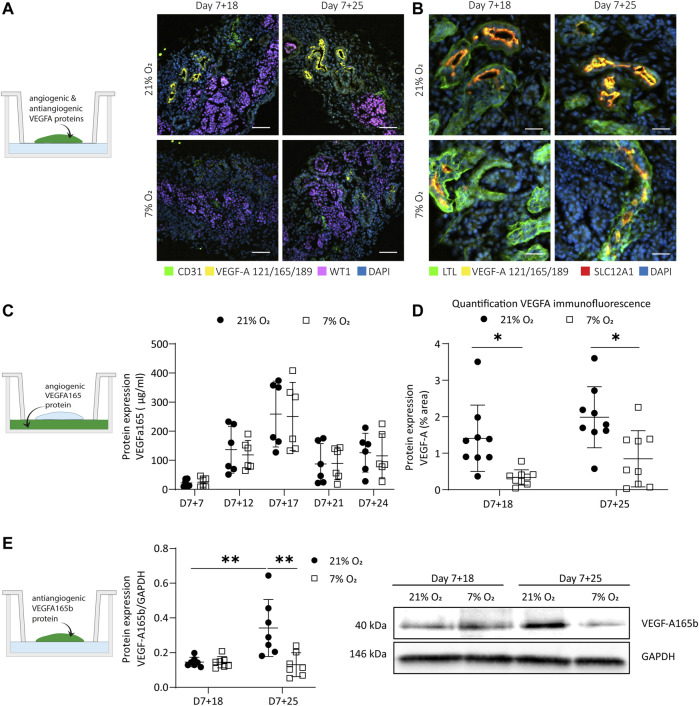
FIGURE 4.
Expression of hypoxia-responsive VEGF-A in organoids cultured in 21 and 7% O2. (A). Immunofluorescence for VEGF-A (121, 165, 189 isoforms; yellow), endothelial cells (CD31; green), podocytes (WT1; magenta) and nuclei (DAPI; blue) displays a reduction of VEGF-A in 7% O2 compared to 21% O2 at both day 7 + 18 and day 7 + 25. (n = 3, N = 3). Scale bar: 50 µm. (B). Immunofluorescence shows localization of VEGF-A to the apical side of proximal tubules co-positive for loop of Henle marker (SLC12A1; red). (n = 3, N = 3). Scale bar: 25 µm. (C). VEGF-A165 protein expression measured in the culture medium was differentially expressed over time, but not significantly different in hypoxia compared to normoxia. (n = 3, N = 2). (D). Quantification of immunofluorescence images confirm that VEGF-A was significantly lower expressed in hypoxia compared to normoxia. (n = 3, N = 3) (E). The anti-angiogenic VEGF-A165b isoform was significantly upregulated over time in normoxia and significantly downregulated in hypoxia compared to normoxia at day 7 + 25. (n = 2, N = 3). *= p ≤ 0.02, ** = p < 0.003.

