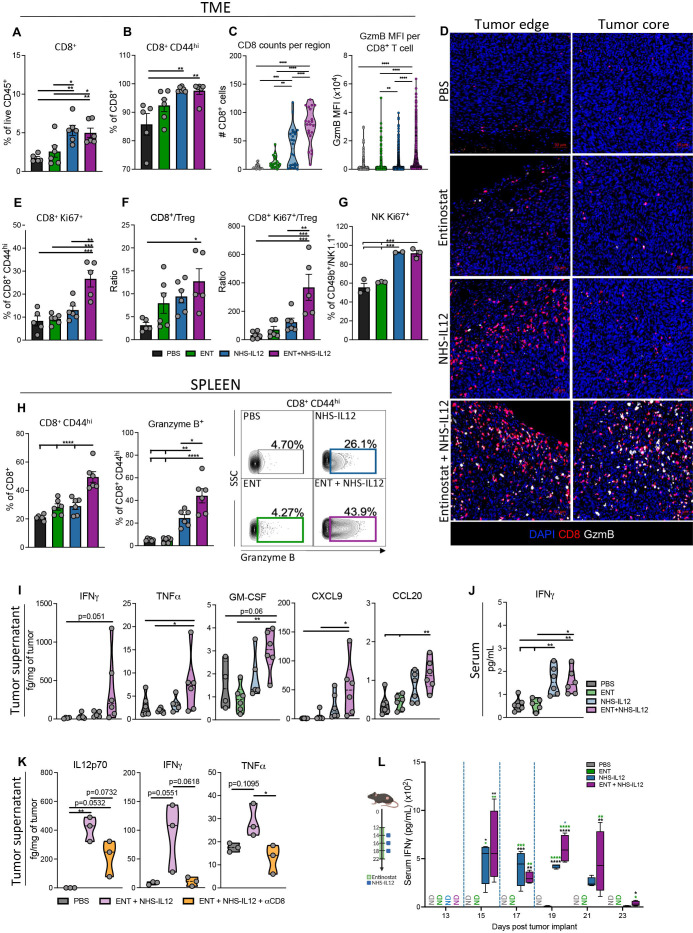
Figure 2.
Combination therapy increases proliferative CD8+ T and NK cells with an antitumorigenic cytokine and chemokine profile in MHC-I deficient TC-1/a9 tumors. TC-1/a9 tumor-bearing mice treated with PBS, entinostat, NHS-IL12 or entinostat+NHS-IL12 were sacrificed 7 days after last dose of NHS-IL12 as in figure 1I, n=5–6 mice/group (A and B, E and F, H and J) or 2 days after last dose of NHS-IL12, n=3–4 mice/group (C and D, G, K, L). CD8+ T and NK cells were analyzed by flow cytometry. (A) CD8+ TILs as frequency of CD45+ cells. (B) Frequency of CD8+CD44hi TILs. (C–D) CD8+ T cells and granzyme B were examined by immunofluorescence (IF). (C) IF quantification of CD8+ T cells per region of interest (six equal sized regions per tumor; 1 dot=1 region) and mean fluorescence intensity (MFI) of granzyme B per CD8+ T cell in tumor core. (D) Representative images of immune fluorescent staining for DAPI (blue), CD8 (red), and granzyme B (white); scale bar, 50 µm. (E) Frequency of CD8+CD44hi cells expressing Ki67. (F) Tumor CD8+ (CD44hi) TIL-to-Treg and CD8+Ki67+ (CD44hi) TIL-to-Treg ratios. (G) Frequency of CD49b+/NK1.1+ NK cells expressing Ki67. (H) Frequency of splenic CD8+ T cells expressing CD44hi and CD8+CD44hi T cells expressing granzyme B with representative contour plots. (I) Levels of designated cytokines and chemokines in the TME. (J) Levels of serum IFN-γ. (K) Levels of designated cytokines in the TME. (L) Serum IFN-γ kinetics in TC-1/a9 tumor-bearing mice as treated in schematic (blue dashed line indicates timing of NHS-IL12 dosing), n=4 mice/group. Bar graphs show mean±SEM. Data shown are representative of 1 (C, D, F–L) or 2 (A, B, E) independent experiments yielding similar results. Truncated violin plots show values from individual mice with contours denoting distribution density, dashed line denoting median, and dotted lines denoting quartiles. Bar graphs and violin plots: One-way ANOVA with Tukey’s multiple comparisons test; Box plot: Two-way ANOVA with Tukey’s multiple comparisons test. *p<0.05, **p<0.01, ***p<0.001, ****p<0.0001. ANOVA, analysis of variance; IFN-γ, interferon gamma; MHC-I, major histocompatibility complex class I; NK, natural killer; PBS, phosphate-buffered saline; TIL, tumor-infiltrating lymphocyte; TME, tumor microenvironment; Treg, regulatory T cell.

