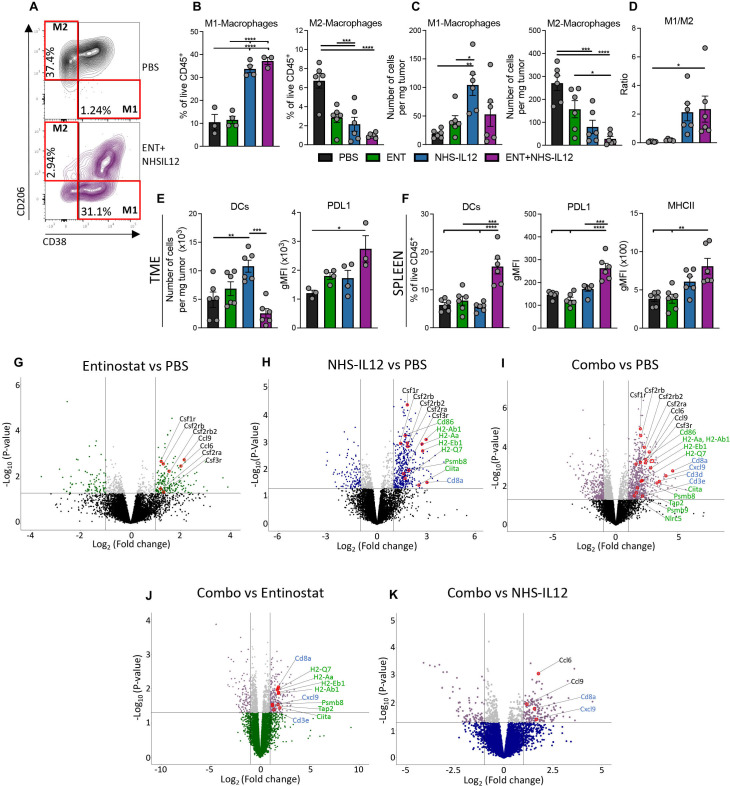
Figure 3.
Combination therapy shifts macrophage M1-to-M2 ratio while increasing genes associated with antigen presentation, CD8+ T cells, and monocytic/macrophage lineage. TC-1/a9 tumor bearing mice treated as in figure 1I were sacrificed on day 21 post-tumor implant (7 days after last dose of NHS-IL12), n=6 mice/group. M1-like and M2-like macrophages and DCs in TME and/or spleen were analyzed by flow cytometry. (A) Representative flow cytometry contour plots of M1-like (F4/80+/CD38+/CD206neg) and M2-like (F4/80+/CD38neg/CD206+) TAMs in mice treated with PBS or combination therapy. M1- and M2-like TAMs as (B) frequency of CD45+ cells and (C) number of cells per milligram of tumor. (D) Ratio of M1-to-M2 TAMs. (E) Numbers of DCs per milligram of tumor and PD-L1 expression (gMFI) on DCs. (F) Frequency of CD45+ splenic DCs plus PD-L1 and MHC-II expression (gMFI) on DCs. (G–K) TC-1/a9 tumor-bearing mice treated as in figure 1I were sacrificed on day 25 post-tumor implant and tumor whole transcriptome analysis was performed, n=3–4 mice/group. Volcano plots show differentially expressed genes (p<0.05) relative to PBS control for (G) entinostat, (H) NHS-IL12, and (I) combination therapy, and combination therapy relative to (J) entinostat and (K) NHS-IL12. Right upper quadrant shows genes upregulated. Horizontal lines indicate threshold for significant changes in gene expression. Gene names highlighted are as follows: green, genes associated with antigen presentation; blue, genes associated with T-cell activation; black, genes involved in migration and differentiation of monocytic/macrophage lineages. Bar graphs show mean±SEM. Data are representative of 1 (F–K) to 2 (A–E) independent experiments yielding similar results. Bar graphs: one-way ANOVA with Tukey’s multiple comparisons test. *p<0.05, **p<0.01, ***p<0.001, ****p<0.0001. ANOVA, analysis of variance; DC, dendritic cell; gMFI, geometric mean fluorescence intensity; MHC-II, major histocompatibility complex class II; PBS, phosphate-buffered saline; PD-L1, programmed death ligand 1; TAM, tumor-associated macrophage; TME, tumor microenvironment.

