
Figure 2.
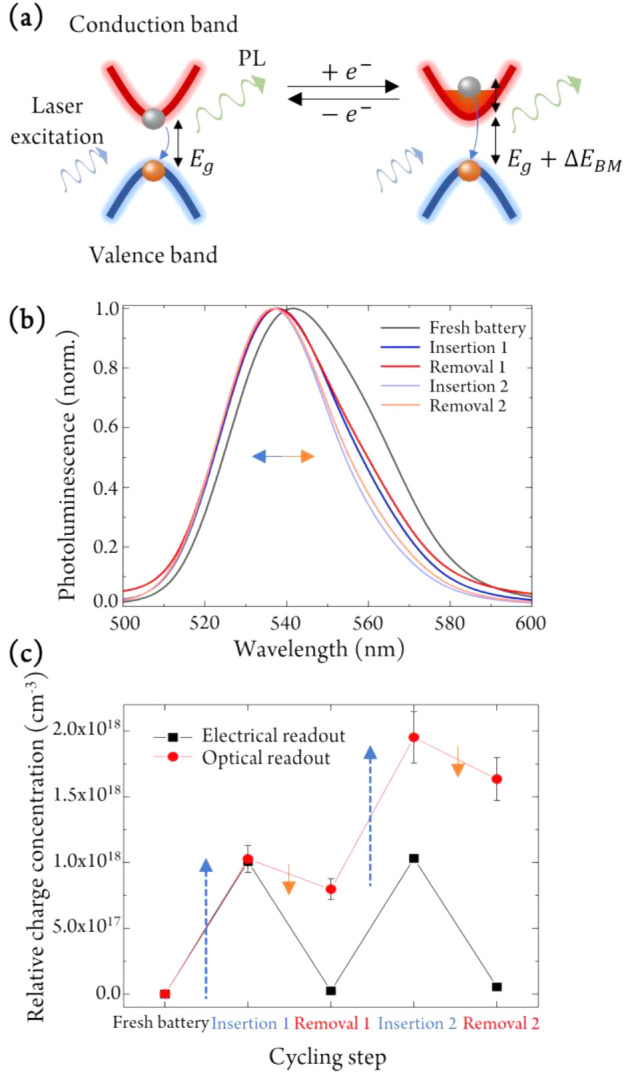
In situ determination of the HP doping concentration. (a) Sketch of Burstein–Moss (BM) induced PL changes, related to the charge density present in the battery at each stage of operation. Definitions: Eg, band gap energy of the perovskite; ΔEBM, change in energy gap due to the BM effect. (b) In situ PL spectra of the battery at different cycling steps. (c) Doping concentration of the perovskite as extracted from PL data (red circles) and electrochemical readout (black squares) after each charge insertion and removal process. Arrows denote equal amounts of charge density added (blue) or removed (orange), revealing that losses mostly occur during the charge removal (i.e., recharging) step, while the n-type doping process is highly efficient.