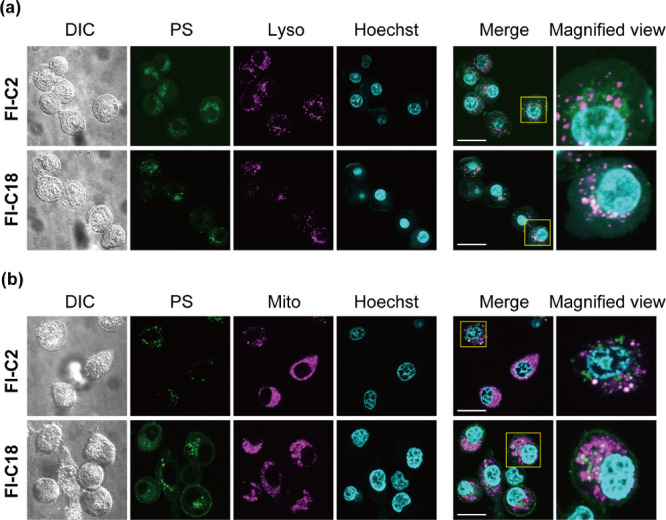
Figure 6.

CLSM images of PC9-luc cells with (a) Fl-C2, Fl-C18, LysoTracker, and Hoechst and (b) Fl-C2, Fl-C18, MitoTracker, and Hoechst. The images show differential interference contrast, dye (Fl-C2 or Fl-C18), tracker, Hoechst, merge, and the magnified view of merged images from left to right. Scale bar: 20 μm. Experimental conditions: [Fl-C2] = [Fl-C18] = 100 nM, [MitoTracker] = 250 nM, [LysoTracker] = 75 nM, and [Hoechst] = 500 nM, 37 °C.
