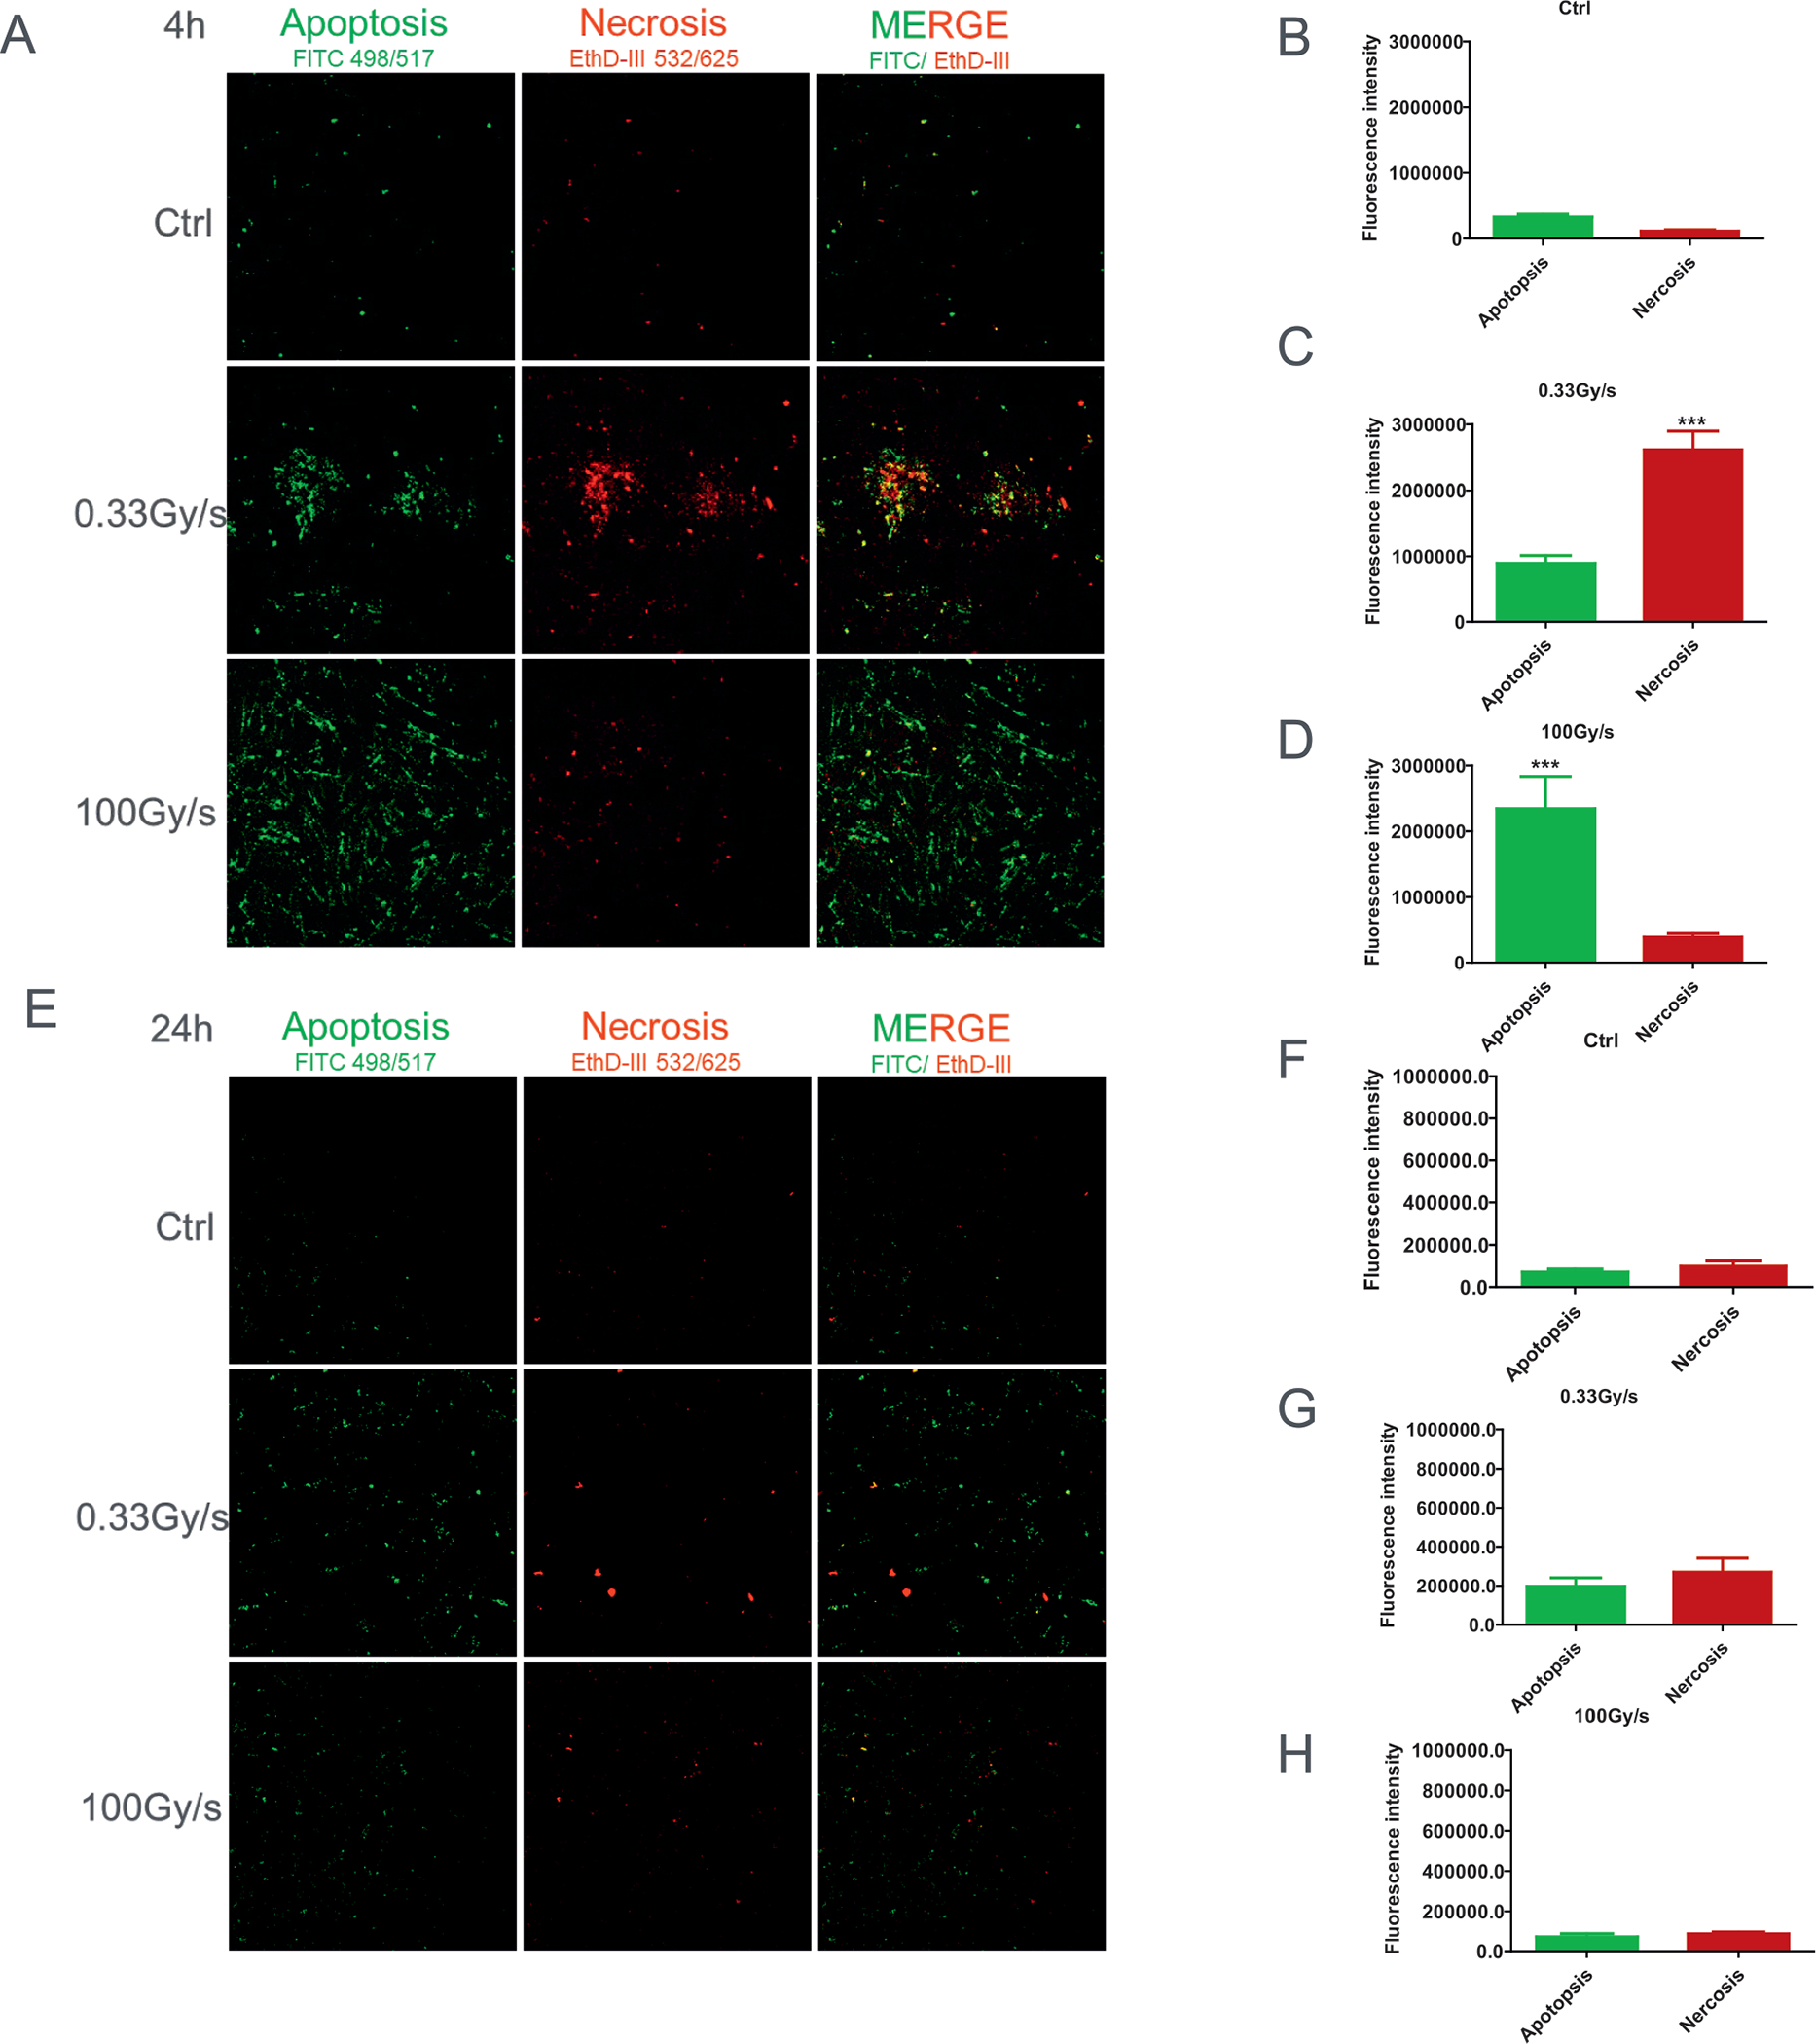
FIG. 5.

The fate of proton-irradiated normal cells delivered at different dose rates. Panel A: Representative images of controls (Ctrl) or proton-irradiated cells delivered at 0.03 Gy/s or 100 Gy/s, analyzed at 4 h postirradiation, stained with AnnV/ EtD-III for 20 min. Typical fluorescence images of FITC-Texas Red or Cy3 filter sets at 200×. Apoptotic cells (green) and necrotic cells (red). Panels B–D: Quantification of AnnV/EtD-III stain (red/green fluorescence). Panels E–H: Apoptosis and necrosis level change, relative to control, after 15 Gy proton irradiation delivered at 0, 0.03 Gy/s or 100 Gy/s and assayed at 24 h postirradiation. ***P ≤ 0.001. For each independent experiment (n = 3), the images of at least 10 randomly selected fields of view were analyzed per each treatment group.
