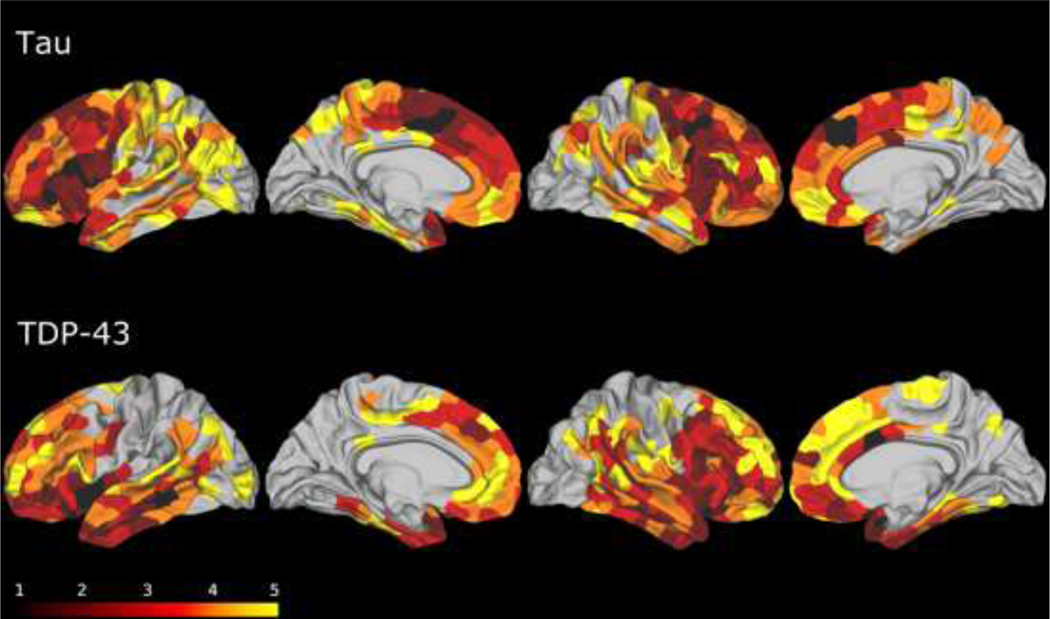
Fig. 1. Results of the MRI phase assignment algorithm for FTLD-tau (top) and FTLD-TDP (bottom) cohorts.
Phase 1 (black): putative epicenters of disease. Phase 2: maroon: Phase 3: red: Phase 4: orange: Phase 5: yellow. The remainder of brain regions (uncolored) had minimal atrophy and were considered to be below staging.

