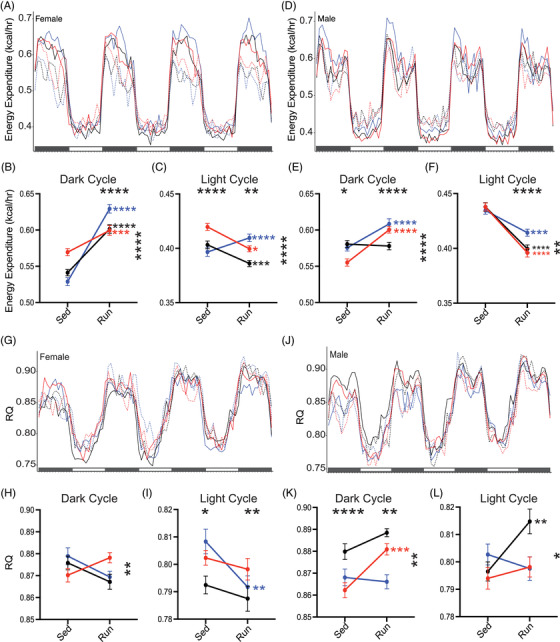
FIGURE 4.

Running influences energy expenditure differently between females and male apolipoprotein E (APOE) mice. A‐C, Energy expenditure (kcal/hr) across four dark cycles and three light cycles for female mice (n = 9–11). Energy expenditure (kcal/hr) significantly affected by APOE gentoype:running, and running during the dark cycle (B), with an increase in energy expenditure in running mice. APOE genotype:running, APOE genotype, and running all influenced light cycle energy expenditure (C), with APOE ε3/ε3 increasing with running while APOE ε3/ε4 and APOE ε4/ε4 decreased energy expenditure with running. D‐F, Energy expenditure (kcal/hr) across four dark cycles and three light cycles for male mice (n = 9–12). E, APOE genotype:running, APOE genotype, and running all affected dark cycle energy expenditure in male mice. F, APOE genotype:running and running showed an overall decrease in energy expenditure in running male mice. G‐I, Respiratory quotient (RQ) across four dark cycles and three light cycles for female mice (G). APOE genotype:running significantly affected RQ during the dark cycle for female mice (H). APOE genotype and running significantly affected RQ during the light cycle for female mice (I). J‐L, RQ across four dark cycles and three light cycles for male mice (J). APOE genotype:running, APOE genotype, and running all significantly affected RQ during the dark cycle in male mice (K). APOE genotype:running significantly affected RQ during the light cycle (L). Solid lines indicate Run mice, dashed lines indicate Sed mice (A,D,G,J). Data presented as mean ± standard error of the mean, two‐way analysis of variance performed for APOE genotype (significant marked above “Sed” column, indicating an effect of APOE genotype), Running (significance marked above “Run” column, indicating an effect of running), and the interaction between APOE genotype:running (significance marked to the right of the graph). Bonferroni's multiple comparisons performed for within genotype running effects (significance marked in smaller stars directly to the right of the run column, within graph limits, in the color of the genotype). *P < .05, **P < .01, ***P < .001, ****P < .0001
