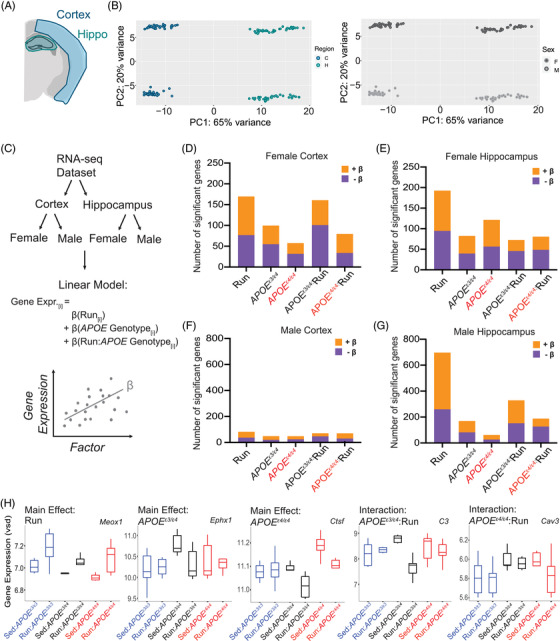
FIGURE 5.

Transcriptional profiling reveals subtle changes due to apolipoprotein E (APOE) genotype and running in the cortex and hippocampus. A, Diagram of the cortical and hippocampal regions of the brain taken for transcriptional profiling (n = 6 per sex/genotype/activity). B, Principal components analysis revealed clear separations between brain regions (cortex and hippocampus, 65% variance explained), as well as by sex (female and male, 20% of variance explained). C, Schematic of the computational analysis approach; first RNA‐seq was separated by brain region, next separated again by sex. Four linear models were run to examine gene expression as it varies with running, APOE genotype, and the interaction between APOE genotype:running. β‐value is the association of the gene with the factor tested—positive β‐value indicates a positive correlation, negative β‐value indicates a negative correlation. D‐G, Number of significant genes (false discovery rate corrected) for female cortex (D), female hippocampus (E), male cortex (F), and male hippocampus (G). H, Example of a significant gene for each of the main effects and interactive effects: Meox1 (Hippocampus, Male), Ephx1 (Hippocampus, Male), Ctsf (Hippocampus, Female), C3 (Hippocampus, Male), Cav3 (Cortex, Male)
