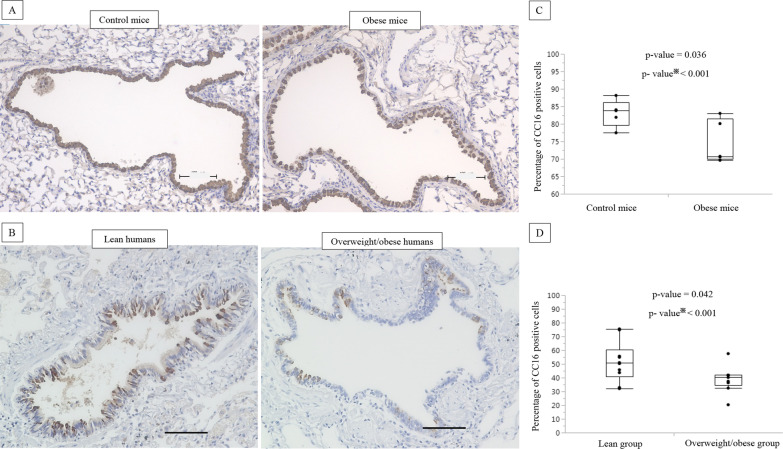
Fig. 2.
Decreased number of CC16 expressing cells in small airways of obese mice and overweight/obese humans. Representative photomicrographs of CC16 immuno-histochemical staining of obese vs. control mice (n = 5 mice per group) (A) and overweight/obese vs. lean human airways (B). Comparison of the percentage of CC16 expressing cells in the small airways of obese vs. normal control mice (n = 5 mice per group) (C). Comparison of the percentage of CC16 expressing cells in the small airways of overweight/obese vs. lean humans (n = 10 for the lean group, and n = 9 for the overweight/obese group) (D). The number of cells expressing each target protein in the small airways was manually and randomly counted in five randomly selected fields by two blinded examiners to determine the average percentage of positive cells/sample. The scale bars are 100 µm. ※split-plot method (ANOVA)

