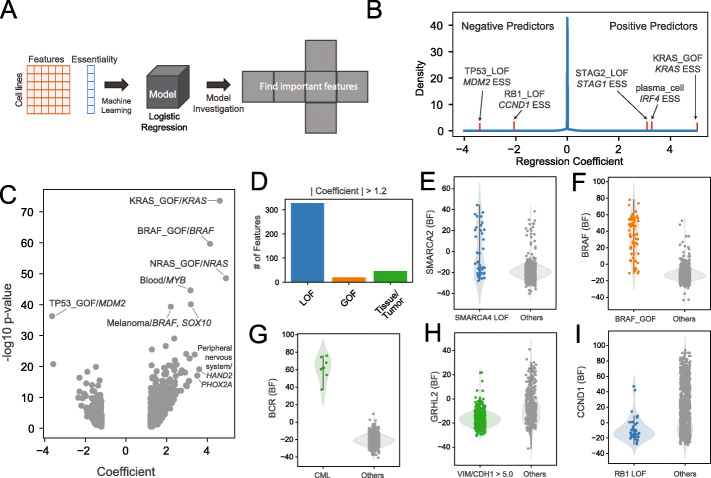
Fig. 1.
Underlying drivers of gene essentiality. A Schematic of the process for finding important contexts for a gene. We input binary feature vectors across all cell lines and a vector of essentiality of a gene and trained a logistic regression model. Then, we investigated coefficients of features to determine the features important for predicting gene essentiality. B Distribution of regression coefficients collected from prediction models of all genes. Positive coefficients reflect gene essentiality in the presence of the feature, and negative coefficients reflect gene essentiality in the absence of the feature. C Volcano plot demonstrates consistency between P-values of Fisher exact test (Y axis) and regression coefficients (X axis). D Category of 393 features with |regression coefficient| > 1.2. E–I Examples of predictions from E paralog interaction, F oncogene addiction, G tissue-specific essential genes, H EMT expression signature, and I negative association. BF, Bayes Factor from BAGEL2 analysis of DepMap data (positive = essential, negative = nonessential)

