Fig. 1.
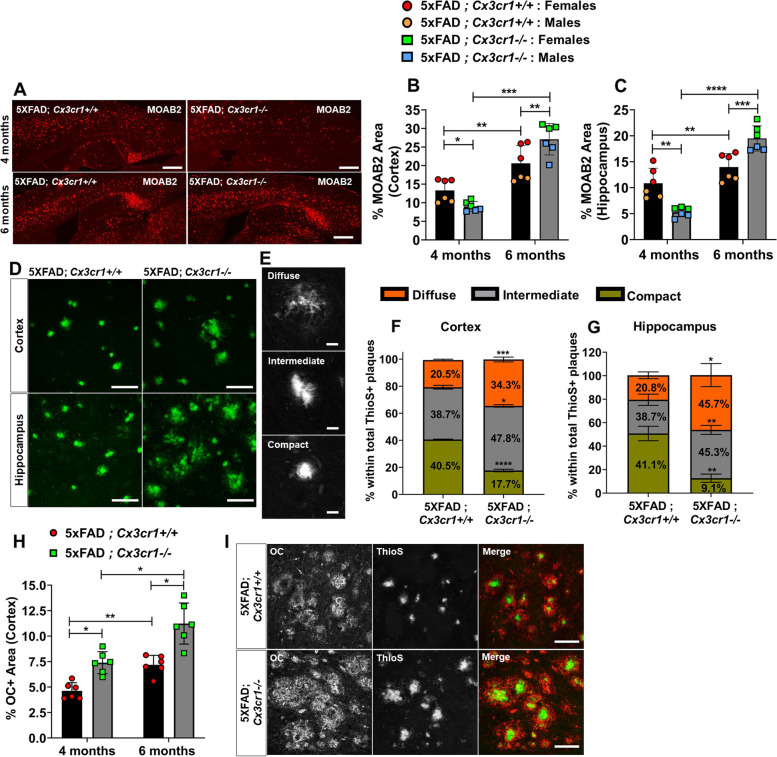
Accelerated plaque deposition in 5xFAD mice deficient in Cx3cr1. (A) Accumulation of MOAB2+ Aβ42 plaques in (top panels) 4 month-old vs. (bottom panels) 6 month-old 5xFAD;Cx3cr1+/+ and 5xFAD; Cx3cr1−/− mice. Scale bars = 500 μm. Quantification of %MOAB2+ areas in the (B) cortex and (C) hippocampus of 4 and 6 month-old 5xFAD;Cx3cr1+/+ (black bars) and 5xFAD;Cx3cr1−/− (grey bars) mice. Data in B,C represent mean proportions of cortical and hippocampal MOAB2+ areas quantified using n = 6 animals (3 females, 3 males) per genotype, per time-point. Error bars represent SEM. Statistical analysis done using two-way ANOVA (pint cortex < 0.0001, pint hippocampus < 0.0001) followed by Tukey’s post hoc tests. (D) ThioS+ plaques visualized in the (top panels) cortex and (bottom panels) hippocampus of 6 month-old 5xFAD mice with and without Cx3cr1. Scale bars = 50 µm. (E) Identification of morphologically distinct ThioS+ plaques based on circularity scores as follows – Diffuse: Circularity = 0.00–0.14, Intermediate: Circularity = 0.15–0.28, Compact: Circularity = > 0.30. Scale bars = 30 µm. Proportion of ThioS+ plaques with diffuse (orange), intermediate (grey) and compact (green) circularities were quantified in the (F) cortex (G) hippocampus of 6 month-old 5xFAD;Cx3cr1+/+ and 5xFAD;Cx3cr1−/− mice. Data in F,G represent mean proportions of each plaque type quantified using 6 mice (3 females, 3 males) per genotype at each age. Circularity analysis was based on 250–300 cortical plaques and 100–150 hippocampal plaques per animal, per genotype at each age. Error bars represent SEM. Statistical analysis done using two-way ANOVA (pint cortex and pint hippocampus = 0.0002) followed by Tukey’s post hoc tests. (H) Quantification of cortical area occupied by OC+ oAβ in 4- and 6-month-old 5xFAD;Cx3cr1+/+ (black bars) and 5xFAD;Cx3cr1−/− (grey bars) mice. Data represents mean proportion of OC+ cortical area quantified using n = 6 (3 females, 3 males) of each genotype at each age. Statistical analysis done using two-way ANOVA (pint = 0.03) followed by Tukey’s post hoc tests. (I) Accumulation of soluble OC+ oAβ around ThioS+ plaques in 6 month-old 5xFAD;Cx3cr1+/+ and 5xFAD;Cx3cr1.−/− mice. Scale bars = 100 μm. *p < 0.01, **p < 0.001, ***p < 0.0001. ****p < 0.00001. All histology data representative of n = 6 mice (3 females, 3males) per genotype at each age analyzed

