Fig. 2.
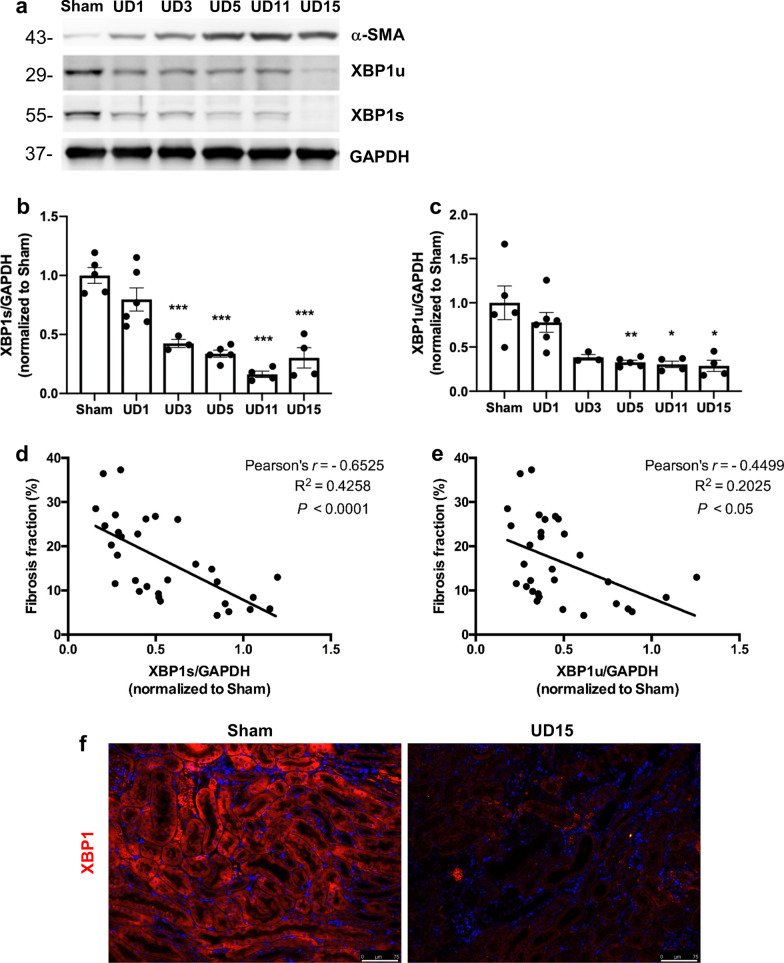
The expression of XBP1u and XBP1s was negatively correlated with post-AKI fibrosis. a Western blot analysis showed the expression of α-SMA, XBP1u, and XBP1s proteins. GAPDH was used as an internal control. b and c Quantification of fold-changes in expression levels of XBP1s (b) and XBP1u (b). Data are expressed as means ± SEM, n = 3 ~ 6 in each group. *P < 0.05, **P < 0.01, and ***P < 0.001, as compared with sham group. d and e Linear regression analysis of the correlation between fibrosis fraction and (d) XBP1s or (e) XBP1u protein expression in UIRI mice. f Representative images of XBP1 stained renal sections after 15 days of UIRI or Sham surgery. Scale bar: 75 μm

