
Figure 1.
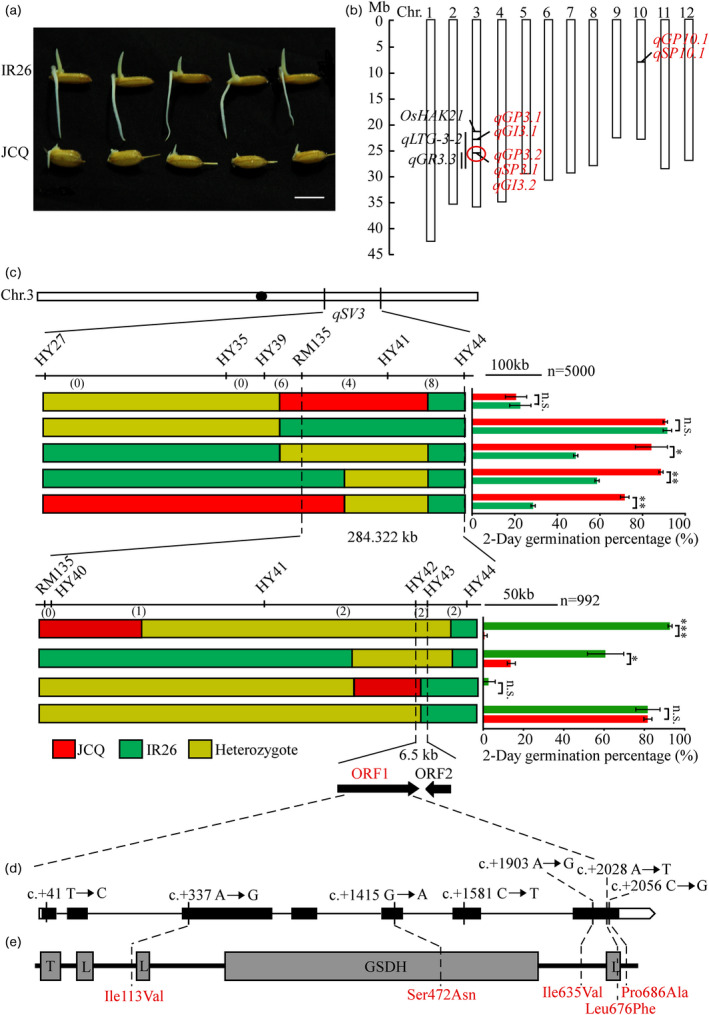
Map‐based cloning of qSV3. (a) Parental phenotype after 3 days after germination. Bar = 1 cm. (b) Physical mapping of QTLs related to seed vigour. Red QTLs identified based on CSSL population in this study and circle locus includes the major qGP3.2, qGI3.2 and qSP3.1, which is named qSV3. The black QTLs have been reported previously and black lines show their physical regions. (c) The qSV3 locus was fined within a 6.5 kb region between markers HY42 and HY43 on chromosome 3. Black circle represents the centromere. Numbers below the horizontal line are the number of recombinants. Red bars represent the JCQ genotype region; green and yellow bars represent IR26 genotype and heterozygous genotype respectively. Right: Germination percentage 2 days after germination. Each column presents the means ± standard deviations of three biological replicates (*P < 0.05, **P < 0.01 and ***P < 0.001) compared with the control by Student’s t‐test. n.s. represents no significance. Candidate genes ORF1 and ORF2 are LOC_Os03g48540 and LOC_Os03g48550 respectively. (d) Gene structure of ORF1. Empty boxes refer to 5′ and 3′ UTRs, black boxes to exons and the lines between boxes to introns. The SNPs from JCQ to IR26 in the OsHIPL1 are shown by solid lines; SNP1, c.+41T→C; SNP2, c.+337A→G; SNP3, c.+1415G→A; SNP4, c.+1581C→T; SNP5, c.+1903A→G; SNP6, c.+2028A→T; and SNP7, c.+2056C→G. (e) Protein structure of ORF1. T, L and GSDH represents the transmembrane domain, the low complexity region and glucose/sorbosone dehydrogenase domain predicted respectively. Dashed lines show the positions of two amino acid transitions.