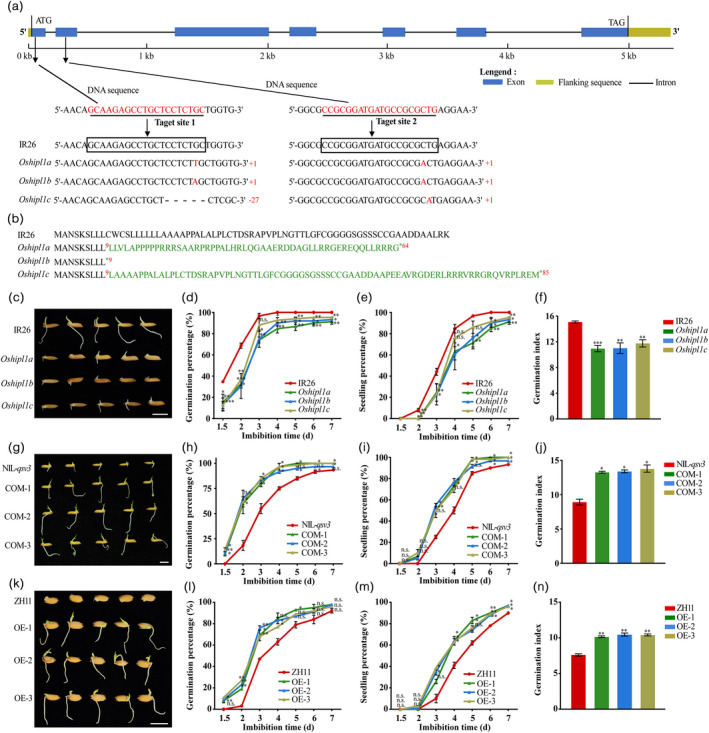
Figure 2.

Functional analysis of OsHIPL1 during seed germination. (a) Target sites are marked in red. Sequences in boxes are the target sequences in the wild type (WT). Black dashes represent the deleted bases and inserted nucleotides are indicated with red uppercase letters. (b) Analysis of the OsHIPL1 protein sequence in the wild‐type (WT) and OsHIPL1‐knockout lines. (c) Photographs of germinated seeds of Oshipl1 mutants and IR26 (control) after 3 days after germination. (d–f) Comparison of germination percentage (d), seedling percentage (e) and germination index (f) between Oshipl1 mutants and IR26. (g) Photographs of germinated seeds of COM lines and NIL‐qsv3 (control) after 3 days after germination. (h–j) Comparison of germination percentage (h), seedling percentage (i) and germination index (j) between COM lines and NIL‐qsv3. (k) Photographs of germinated seeds of OE lines and ZH11 (control) after 3 days after germination. (l–n) Comparison of germination percentage (l), seedling percentage (m) and germination index (n) between OE lines and ZH11. Bar = 1 cm. Each column presents the means ± standard deviations of three biological replicates. *P < 0.05, **P < 0.01 and ***P < 0.001 compared with the control by Student’s t‐test.
