
Figure 4.
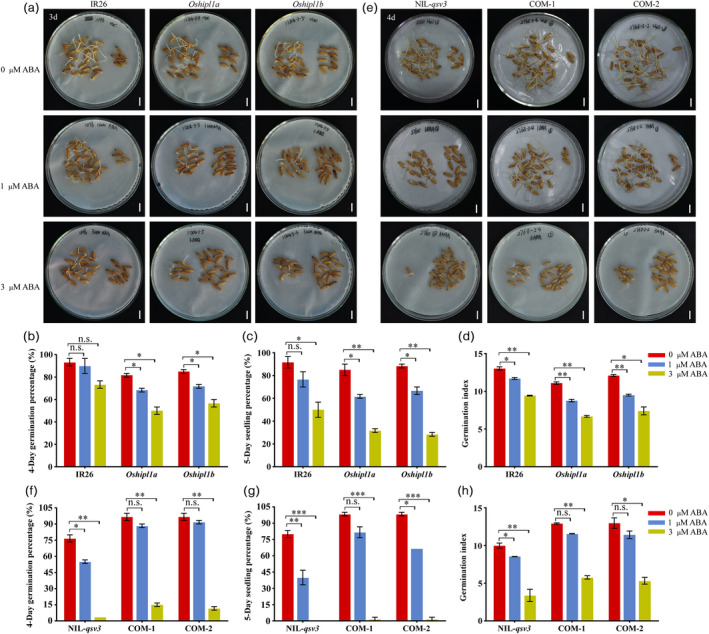
Effects of ABA treatments on OsHIPL1 during seed germination. (a) Photographs of germinated seeds of Oshipl1 mutants and IR26 after 3 days after germination with 0, 1 and 3 μm ABA treatments. (b–d) Comparison of germination percentage (b), seedling percentage (c) and germination index (d) of Oshipl1 mutants and IR26 in the presence of ABA. (e) Photographs of germinated seeds of COM lines and NIL‐qsv3 after 4 days after germination with 0, 1 and 3 μm ABA treatments. (f–h) Comparison of germination percentage (f), seedling percentage (g) and germination index (h) of COM lines and NIL‐qsv3 in the presence of ABA. Bar = 1 cm. Each column presents the means ± standard deviations of three biological replicates. *P < 0.05, **P < 0.01 and ***P < 0.001 compared with the control by Student’s t‐test. n.s. represents no significance.