Figure 6.

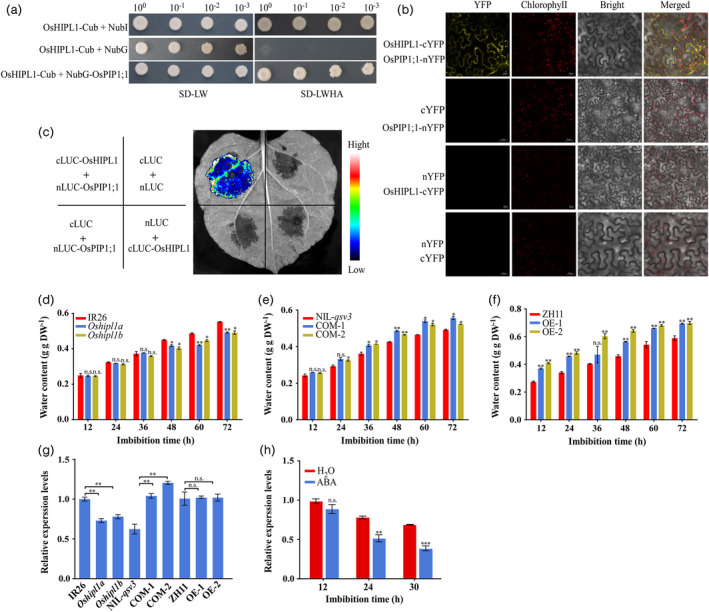
OsHIPL1 interacts with OsPIP1;1 and promotes water uptake during seed germination. (a) Yeast two‐hybrid screening assay. Interaction of OsHIPL1 with OsPIP1;1 is indicated by the ability of yeast cells to grow on dropout medium lacking Leu, Trp, His and Ade for 4 days after plating. CUB, C‐terminal half of ubiquitin; Nub, N‐terminal half of ubiquitin; NubG, negative control with a point mutation in Nub; NuBI, positive control. The experiments were repeated three times with similar results. (b) Bimolecular fluorescence complementation (BiFC) assay. The fluorescence resulted from the complementation of the C‐terminal portion of YFP fused to OsHIPL1 (OsHIPL1‐cYFP) with the N‐terminal portion of YFP fused to OsPIP1;1 (OsPIP1;1‐nYFP). Fluorescence was observed in tobacco leaf epidermal cells. (c) Firefly luciferase (LUC) complementation imaging assay. cLUC‐OsHIPL1 and nLUC‐OsPIP1;1 with the control vector were co‐infiltrated into N. benthamiana leaves. LUC images were captured at 48 h after infiltration. (d–f) Water contents of Oshipl1 mutants and IR26 (d), COM lines and NIL‐qsv3 (e) and OE lines and ZH11 (f) during seed germination. (g) Comparison of the transcription levels of OsPIP1;1 among IR26, Oshipl1 mutants, NIL‐qsv3, COM lines, ZH11 and OE lines at 24 h after imbibition using the RT‐qPCR approach. The relative expression levels were represented by fold change relative to the expression levels of IR26 or ZH11. The expression of OsPIP1;1 was normalized to that of OsActin gene control. (h) Transcription levels of OsPIP1;1 response to ABA treatments in germinated seeds were conducted using the RT‐qPCR approach. The relative expression levels were represented by fold change relative to the expression level of OsPIP1;1 at 12 h after imbibition without ABA. Each column presents the means ± standard deviations of three biological replicates. *P < 0.05, **P < 0.01 and ***P < 0.001 compared with the control by Student’s t‐test. n.s. represents no significance.
