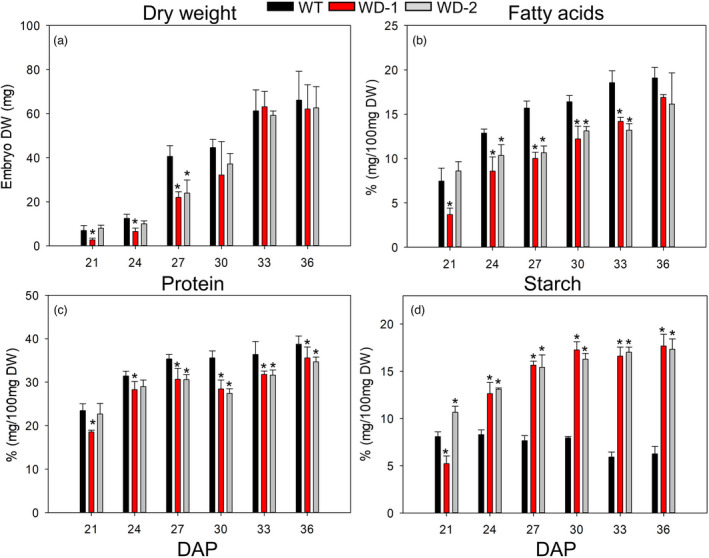
Figure 2.

DW, protein, FA, and starch accumulation during development. Results from soybean grown under greenhouse conditions. The embryo’s DW (a), the content of FA (b), protein (c) and starch (d) are shown in % (mg /100 mg DW). For all pairwise multiple comparison procedures, Fisher LSD method or Student–Newman–Keuls method was used as parametric or non‐parametric test, respectively. Error bars are the standard deviation of four biological replicates and the presence of an asterisk denotes a significant difference with the WT (p < 0.05). DW: Dry weight. DAP: days after pollination. WD‐1 and −2: independent transgenic events expressing AtWRI1 and AtDGAT1.
