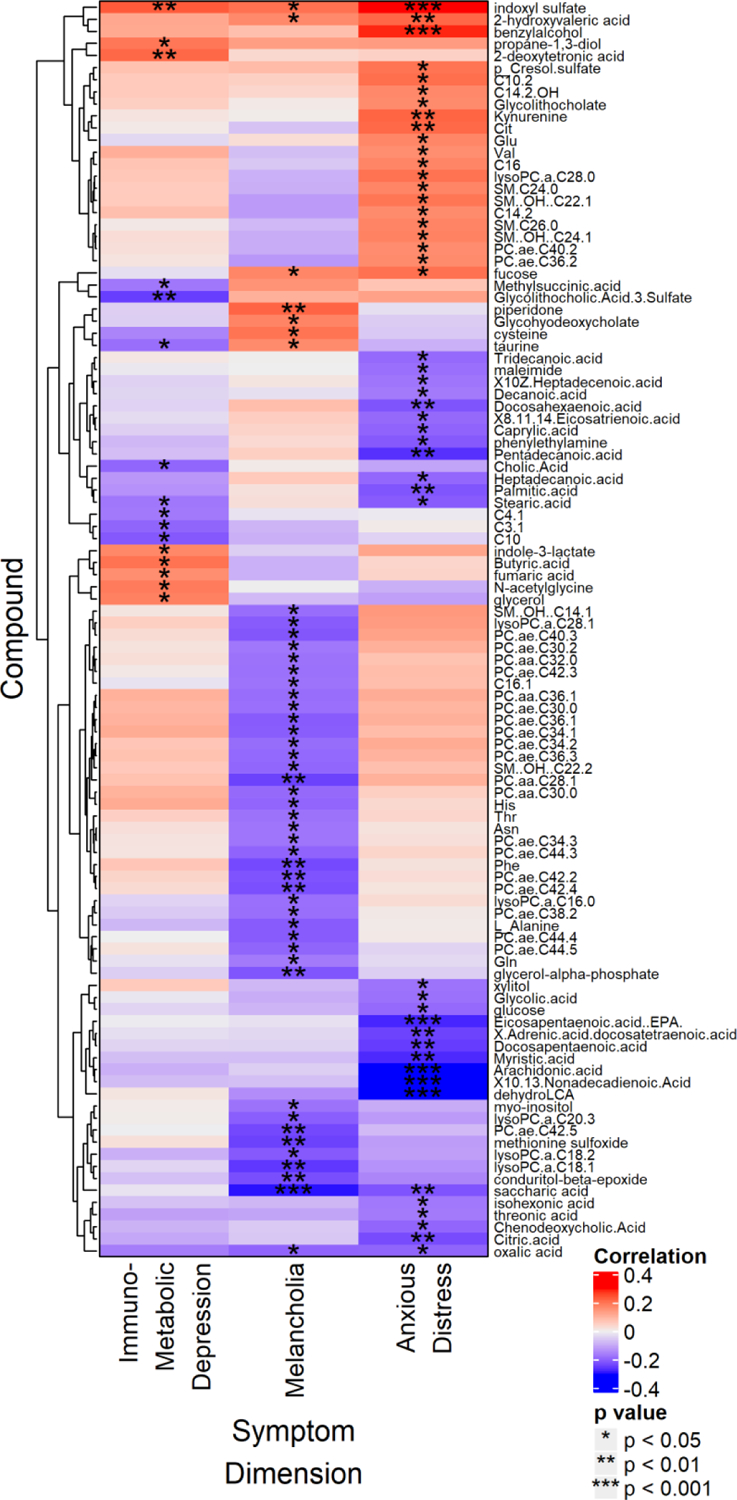
Figure 1.

Heat map displaying partial Spearman rank correlations between compound intensity and Immunometabolic, Anxious distress, and Melancholia dimension scores at baseline, after controlling for age, sex, and BMI. Only identified metabolites that correlated significantly with at least one of the three variables are shown. All p values are uncorrected for multiple comparisons.
