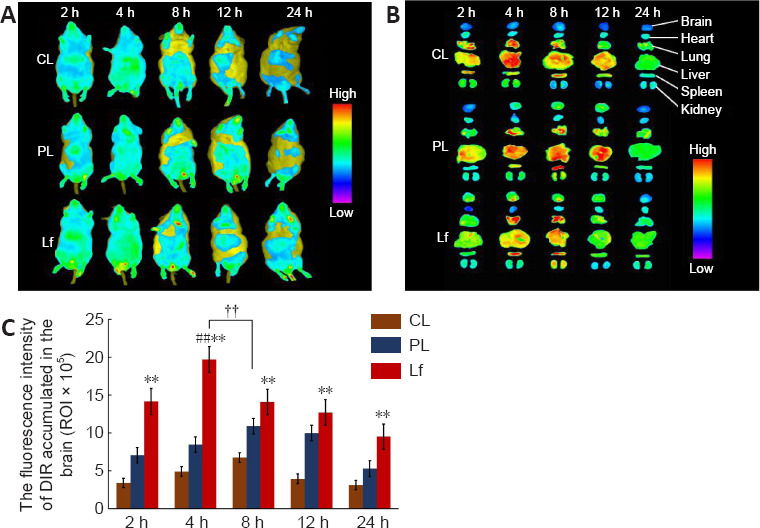
Figure 2.

Distribution of different DiR nanoliposomes in AD-like Aβ neurotoxicity model mice at different time points.
(A, B) In vivo (A) and ex vivo (B) fluorescence images in the brain of a mouse model of AD-like Aβ neurotoxicity. Fluorescence signal in the DiR-Lf group was significantly higher than that in the DiR-CL and DiR-PL groups. There was significant difference in fluorescence intensity between the DiR-CL, DiR-PL and DiR-Lf groups. (C) Ex vivo fluorescence intensity of different DiR nanoliposomes in the brain of a mouse model of AD-like Aβ neurotoxicity. Data are expressed as the mean ± SD (n = 3). **P < 0.01, vs. DiR-CL group; ##P < 0.01, vs. DiR-Lf group; ††P < 0.01 (two-way analysis of variance followed by Duncan’s multiple range test). AD: Alzheimer’s disease; Aβ: amyloid-β protein; DiR: 1, 1′-dioctadecyl-3,3,3′,3′-tetramethyl-indotricarbocyanine iodide; DiR-CL (CL): DiR common nanoliposomes; DiR-Lf (Lf): DiR PEGylated nanoliposomes with lactoferrin modified; DiR-PL (PL): DiR PEGylated nanoliposomes.
