
Figure 2.
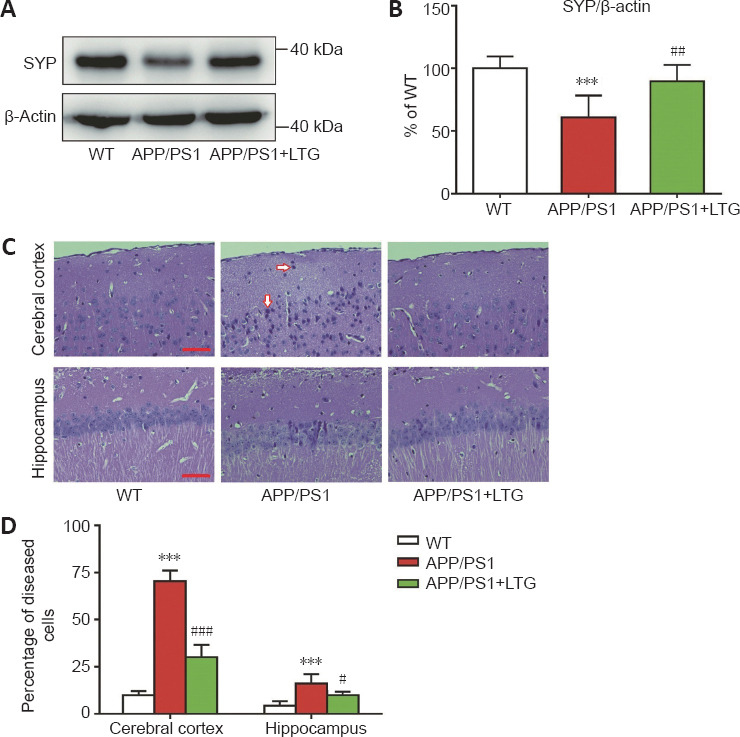
LTG alleviated synapse and nerve cell damage in the brains of APP/PS1 mice.
(A) The protein levels of SYP in the brains of mice were detected using western blot assay. (B) Quantitation of SYP protein levels. (C) Hematoxylin and eosin staining of the cerebral cortex and hippocampal CA1 region in mice. Healthy cells are light blue with prominent nuclei. In contrast, damaged cells (arrows) are darker in color with morphological changes from cellular pyknosis. The number of diseased cells in the cerebral cortex and the hippocampus of APP/PS1 mice was elevated significantly when compared with that of WT controls. LTG treatment significantly reduced the number of diseased cells in the cerebral cortex and the hippocampus of APP/PS1 mice. Scale bar: 50 μm. (D) Quantitation of the percentage of diseased cells in the three groups. Data are expressed as means ± SD (n = 6). ***P < 0.001, vs. WT controls; #P < 0.05, ###P < 0.001, vs. APP/PS1 mice (one-way analysis of variance followed by Tukey’s post hoc test). APP/PS1: Amyloid precursor protein/presenilin 1; LTG: lamotrigine; SYP: synaptophysin; WT: wild-type.