Figure 6.

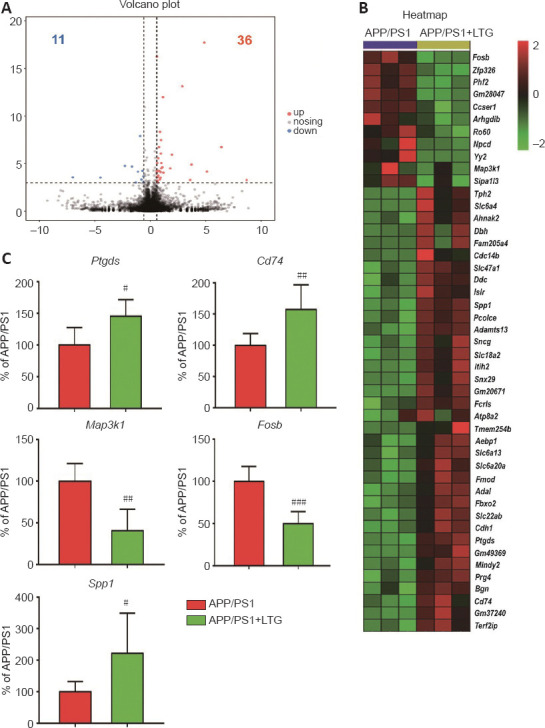
LTG altered the expression of genes that are closely related to Alzheimer’s disease neuropathology.
(A) The volcano plot of DEGs. The red dots represent upregulated genes, and the blue dots represent downregulated genes. (B) The heatmap of DEGs. Red means high expression, and green means low expression (n = 3). (C) Ptgds, Cd74, Map3k1, Fosb, and Spp1 mRNA expression in brains of mice was detected using real-time polymerase chain reaction (n = 6). Data are expressed as means ± SD. #P < 0.05, ##P < 0.01, ###P < 0.001, vs. APP/PS1 mice (Student’s t-test). APP/PS1: Amyloid precursor protein/presenilin 1; DEG: differentially expressed gene; LTG: lamotrigine.
