Figure 3.

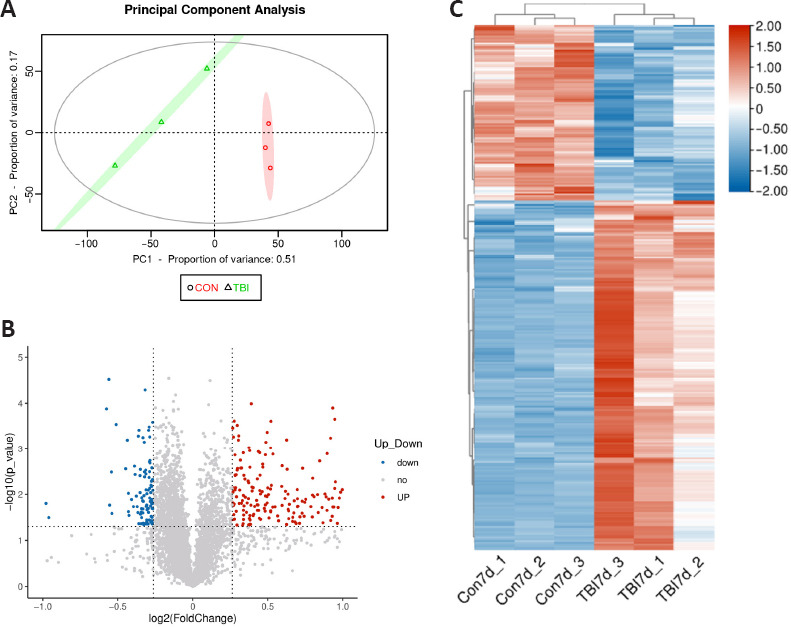
Analysis of cortical DEPs in TBI and control mice.
(A) Principal component analysis plot generated from the proteomics analysis results for the TBI (triangles) and control (circles) mice. (B) Volcano plot of DEPs between the TBI and control mice. Blue, gray, and red dots indicate downregulated, unchanged, or upregulated proteins following controlled cortical impact, respectively. (C) Heatmap of DEPs between the TBI and control mice. The color scale indicates significant differences in the levels of protein expression. CON: Control; DEP: differentially expressed protein; TBI: traumatic brain injury.
