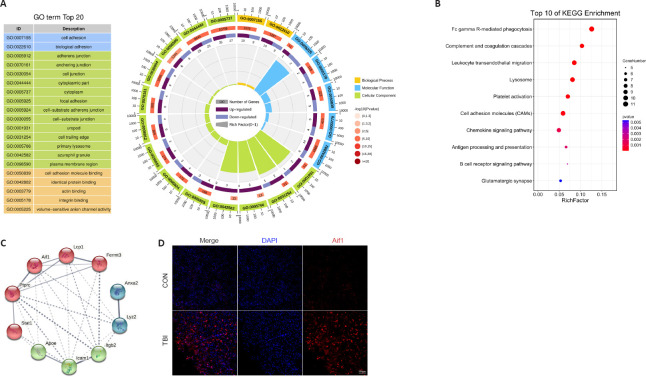
Figure 4.
Gene Ontology (GO), Kyoto Encyclopedia of Genes and Genomes (KEGG), and protein-protein interaction (PPI) analysis of cortical DEPs between the TBI and control mice.
(A) GO functional enrichment analysis of DEPs at 7 days post-TBI. (B) KEGG pathway analysis of DEPs at 7 days post-TBI. (C) PPI network analysis of DEPs at 7 days post-TBI. (D) Representative immunofluorescence images of Aif1 staining (red, stained with Cy3) in the ipsilateral cortex from the TBI and control mice. Aif1 expression was significantly higher in the TBI mice compared with the control mice. The nuclei were stained with DAPI (blue). Scale bar: 100 μm. CON: Control; DAPI: 4,6-diamidino-2-phenylindole; DEP: differentially expressed protein; TBI: traumatic brain injury.

