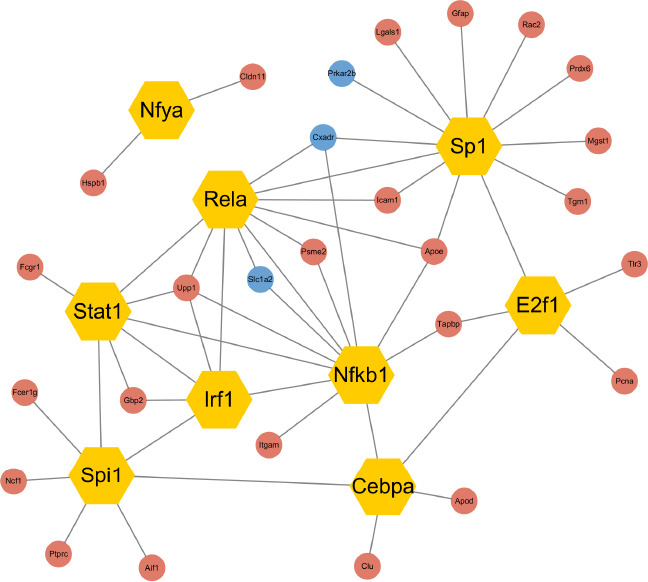
Figure 5.

Regulatory network analysis of transcription factors that were differentially expressed in TBI and control mice.
Regulatory transcription factor interactions with corresponding target genes are illustrated. TFs are shown as hexagonal nodes. Up- or downregulated target genes are shown as red or blue circular nodes, respectively. CON: Control; TBI: traumatic brain injury.
