
Fig. 5.
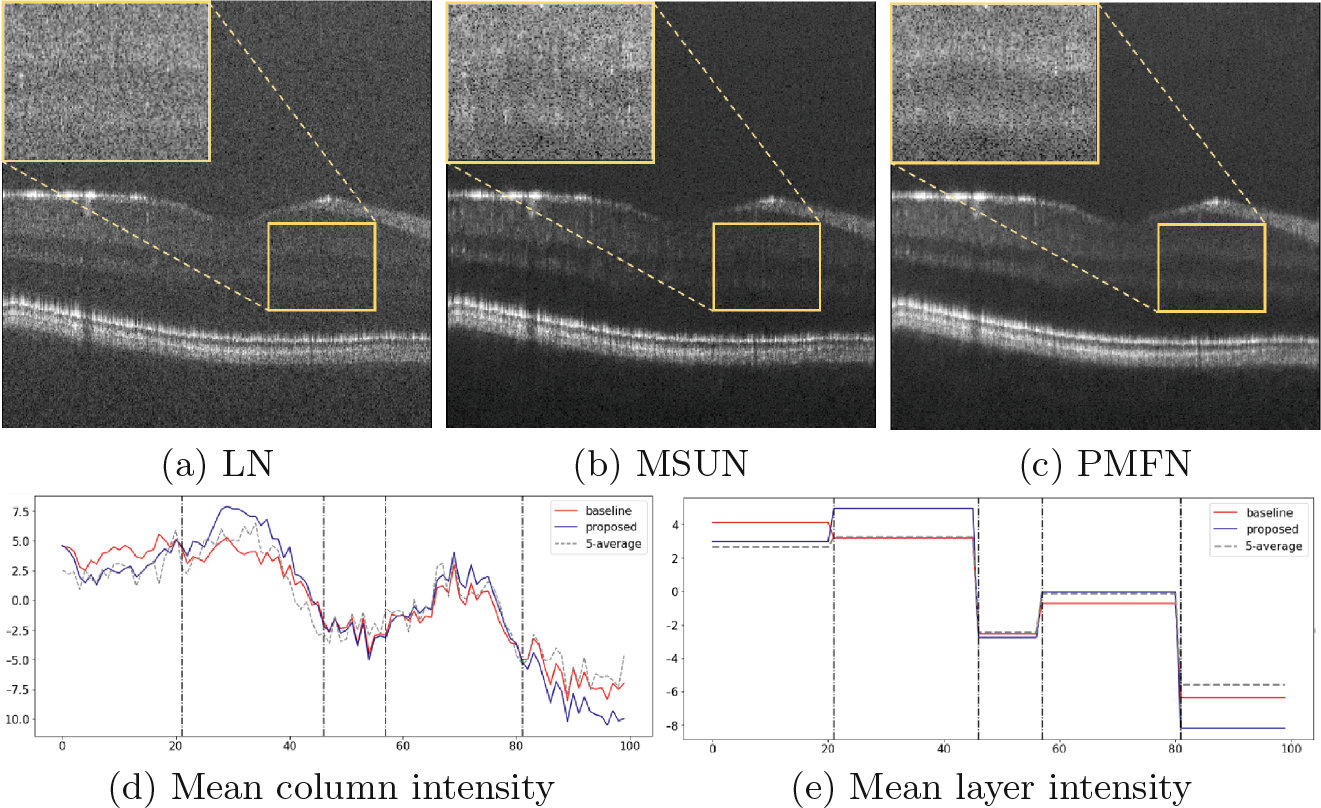
Layer separation analysis. The top row shows an ROI containing 5 layers of tissue (GCL, IPL, INL, OPL, ONL) for each of (a) 5-average LN image, (b) baseline result and (c) PMFN result. (d) plots the intensity across the 5 layers within the ROI. (e) plots the mean intensity per layer. Vertical dashed lines approximate layer boundaries.