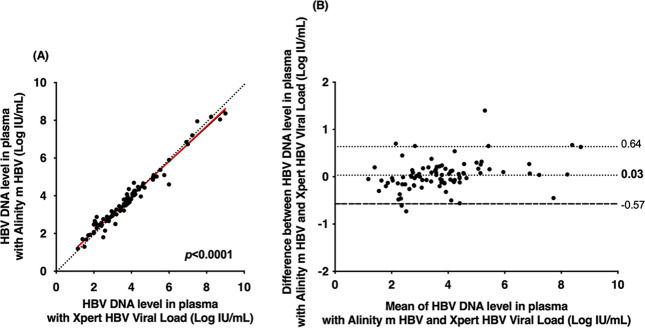
FIG 1.
(A) Deming regression of HBV DNA levels measured by the Alinity m HBV assay and Xpert HBV viral load assay in 91 plasma specimens containing HBV genotype A (n = 14), B (n = 7), C (n = 4), D (n = 9), E (n = 39), or G (n = 3) or an unidentified genotype (15 cases). The red solid line represents Deming regression, and the black dotted line represents the reference (i.e., no difference between the two techniques). (B) Bland-Altman plot analysis of HBV DNA levels measured by the Alinity m HBV assay and Xpert HBV viral load assay in 91 plasma specimens containing HBV genotype A (n = 14), B (n = 7), C (n = 4), D (n = 9), E (n = 39), or G (n = 3) or an unidentified genotype (15 cases). The black dotted and dashed lines represent deviation ± 1.96 SD, respectively.

