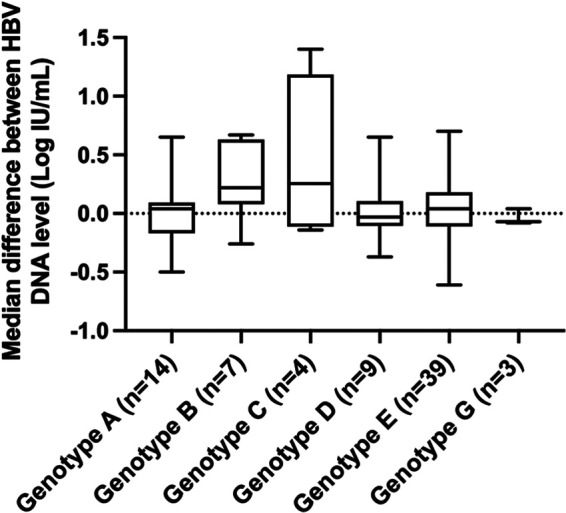
FIG 2.

Box plot representation of the distribution of the differences between HBV DNA levels determined by the Alinity m HBV assay and the Xpert HBV viral load assay according to HBV genotype. The midline and the lower and upper edges of boxes represent the median value, 25th percentile, and 75th percentile, respectively. The lower and upper error bars represent the minimum and maximum values, respectively.
